


Trusted by over 15 Million Traders
The Most Awarded Broker
for a Reason
Easy Access to 1,400+ Global Assets
EURUSD
Euro vs U.S. Dollar
US500
S&P 500 (US500)
GOLD
Gold
COFFEE
US Coffee
Apple
Apple (AAPL.OQ)
-

Finance Magnates 颁发
-

Finance Magnates 颁发
-

Capital Finance International Magazine (CFI.co) 2024年颁赠
-

COLWMA 2024年颁赠
-

荣获World Finance Forex Awards 2023最佳外汇客户服务奖
-

荣获World Finance Forex Awards 2023欧洲最佳外汇经纪商奖
-

荣获World Finance Forex Awards 2023澳大拉西亚最佳外汇经纪商奖
-

荣获World Finance Forex Awards 2023拉丁美洲最佳外汇经纪商奖
-

荣获World Finance Forex Awards 2023中东最佳外汇经纪商奖
-

CFI.co于2023年颁赠
-

荣获2023年City of London Wealth Management Awards
-

荣获2022年埃及金融博览会颁赠
-

荣获2022年City of London Wealth Management Awards
-

CFI.co于2022年颁赠
-

荣获Global Forex Awards 2022 — 零售外汇 颁赠
-
2021年迪拜外汇博览会获颁赠
-

Ultimate Fintech 2021年颁赠
-

荣获2021年City of London Wealth Management Awards
-

FX168于2020年12月颁赠
-

荣获Global Business Awards 2020
-

荣获2020年City of London Wealth Management Awards
-

Capital Finance International Magazine (CFI.co)颁赠
-

Capital Finance International Magazine (CFI.co)颁赠
-

荣获2019年City of London Wealth Management Awards
-

Shares Magazine 授予 UK Forex Awards 2018
-

Capital Finance International Magazine (CFI.co)颁赠
-

Capital Finance International Magazine (CFI.co)颁赠
-

2017年伦敦财富管理奖
-

2016最佳本土 客户服务
-

中东和北非地区(MENA)增长最快的经纪商
-
2015年最佳外汇科技提供商
-
2014年最佳外汇科技提供商
-

2014年最佳外汇科技提供商
-

荣获 The Trading Show 2024年非洲 Africa Fintech 峰会颁赠
-

荣获2024年中东地区 Brokersview 颁赠
-
荣获2024年中东地区 Brokersview 颁赠
-

荣获2024年阿曼 Smart Vision 峰会颁赠
-

荣获2024年迪拜外汇博览会颁赠
-

荣获2024年迪拜 Forex Traders Summit 颁赠
-

2024年埃及 Smart Vision 峰会颁赠
-

投查查于2024年颁赠
-

Capital Finance International Magazine (CFI.co) 2024年颁赠
-

CFI.co于2023年颁赠
-

CFI.co于2023年颁赠
-

交易社区平台FOLLOWME于2022年颁赠
-
2022年迪拜Forex Expo获颁赠
-
2022年迪拜Forex Expo获颁赠
-

荣获Global Forex Awards 2022 — 零售外汇 颁赠
-

CFI.co于2022年颁赠
-

CFI.co于2022年颁赠
-

World Finance Forex Awards 2022 颁发
-

World Finance Forex Awards 2022 颁发
-

World Finance Forex Awards 2022 颁发
-

World Finance Forex Awards 2022 颁发
-
交易社区平台FOLLOWME于2021年颁赠
-

2021年埃及Smart Vision Investment Expo博览会获颁赠
-

CFI.co于2021年颁赠
-

CFI.co于2021年颁赠
-

荣获Global Forex Awards 2021 — 零售外汇 颁赠
-

荣获Global Forex Awards 2021 — 零售外汇 颁赠
-

World Finance 2021颁发
-

World Finance 2021颁发
-
FOLLOWME于2021年颁赠
-

Global Forex Awards 2021 — B2B 颁赠
-

Global Forex Awards颁赠
-

Global Forex Awards颁赠
-

CFI.co于2020年颁赠
-

CFI.co于2020年颁赠
-

荣获Global Business Awards 2020
-

World Finance Magazine 颁赠
World Finance Forex Awards 2020 -

World Finance Magazine 颁赠
World Finance Forex Awards 2020 -
FOLLOWME交易社区授予
-

Global Forex Awards颁赠
-

Global Forex Awards颁赠
-

FinTech Age Awards颁发
-

World Finance Magazine 颁赠
World Finance Forex Awards 2019 -

World Finance Magazine 颁赠
World Finance Forex Awards 2019 -

荣获 World Finance Forex Awards 2018 颁赠
-

荣获2018年埃及金融博览会颁赠
-

荣获 Shares Magazine 的 UK Forex Awards 2017 颁赠
-

荣获 World Finance Forex Awards 2017
-

2016年最佳黄金经纪商
-

2016年最佳外汇经纪商
-

2015年最佳本地客户服务
-

Global Brands Magazine 颁赠
-

Online Money Awards 2022 颁发
-

荣获2022年埃及金融博览会颁赠
-

2015最佳外汇交易平台
-

2015最佳金融交易平台
-

2013最佳创新外汇平台奖
-

2020年 Cyprus HR Awards 颁赠
-

金融行业的佼佼者
-

认证最优金牌级别
-

2014年首届亚军
-
Finance Magnates 颁发
-
Finance Magnates 颁发
-
Capital Finance International Magazine (CFI.co) 2024年颁赠
-
COLWMA 2024年颁赠
-
荣获World Finance Forex Awards 2023最佳外汇客户服务奖
-
荣获World Finance Forex Awards 2023欧洲最佳外汇经纪商奖
-
荣获World Finance Forex Awards 2023澳大拉西亚最佳外汇经纪商奖
-
荣获World Finance Forex Awards 2023拉丁美洲最佳外汇经纪商奖
-
荣获World Finance Forex Awards 2023中东最佳外汇经纪商奖
-
CFI.co于2023年颁赠
-
荣获2023年City of London Wealth Management Awards
-
荣获2022年埃及金融博览会颁赠
-
荣获2022年City of London Wealth Management Awards
-
CFI.co于2022年颁赠
-
荣获Global Forex Awards 2022 — 零售外汇 颁赠
-
2021年迪拜外汇博览会获颁赠
-
Ultimate Fintech 2021年颁赠
-
荣获2021年City of London Wealth Management Awards
-
FX168于2020年12月颁赠
-
荣获Global Business Awards 2020
-
荣获2020年City of London Wealth Management Awards
-
Capital Finance International Magazine (CFI.co)颁赠
-
Capital Finance International Magazine (CFI.co)颁赠
-
荣获2019年City of London Wealth Management Awards
-
Shares Magazine 授予 UK Forex Awards 2018
-
Capital Finance International Magazine (CFI.co)颁赠
-
Capital Finance International Magazine (CFI.co)颁赠
-
2017年伦敦财富管理奖
-
2016最佳本土 客户服务
-
中东和北非地区(MENA)增长最快的经纪商
-
2015年最佳外汇科技提供商
-
2014年最佳外汇科技提供商
-
2014年最佳外汇科技提供商
-
荣获 The Trading Show 2024年非洲 Africa Fintech 峰会颁赠
-
荣获2024年中东地区 Brokersview 颁赠
-
荣获2024年中东地区 Brokersview 颁赠
-
荣获2024年阿曼 Smart Vision 峰会颁赠
-
荣获2024年迪拜外汇博览会颁赠
-
荣获2024年迪拜 Forex Traders Summit 颁赠
-
2024年埃及 Smart Vision 峰会颁赠
-
投查查于2024年颁赠
-
Capital Finance International Magazine (CFI.co) 2024年颁赠
-
CFI.co于2023年颁赠
-
CFI.co于2023年颁赠
-
交易社区平台FOLLOWME于2022年颁赠
-
2022年迪拜Forex Expo获颁赠
-
2022年迪拜Forex Expo获颁赠
-
荣获Global Forex Awards 2022 — 零售外汇 颁赠
-
CFI.co于2022年颁赠
-
CFI.co于2022年颁赠
-
World Finance Forex Awards 2022 颁发
-
World Finance Forex Awards 2022 颁发
-
World Finance Forex Awards 2022 颁发
-
World Finance Forex Awards 2022 颁发
-
交易社区平台FOLLOWME于2021年颁赠
-
2021年埃及Smart Vision Investment Expo博览会获颁赠
-
CFI.co于2021年颁赠
-
CFI.co于2021年颁赠
-
荣获Global Forex Awards 2021 — 零售外汇 颁赠
-
荣获Global Forex Awards 2021 — 零售外汇 颁赠
-
World Finance 2021颁发
-
World Finance 2021颁发
-
FOLLOWME于2021年颁赠
-
Global Forex Awards 2021 — B2B 颁赠
-
Global Forex Awards颁赠
-
Global Forex Awards颁赠
-
CFI.co于2020年颁赠
-
CFI.co于2020年颁赠
-
荣获Global Business Awards 2020
-
World Finance Magazine 颁赠
World Finance Forex Awards 2020 -
World Finance Magazine 颁赠
World Finance Forex Awards 2020 -
FOLLOWME交易社区授予
-
Global Forex Awards颁赠
-
Global Forex Awards颁赠
-
FinTech Age Awards颁发
-
World Finance Magazine 颁赠
World Finance Forex Awards 2019 -
World Finance Magazine 颁赠
World Finance Forex Awards 2019 -
荣获 World Finance Forex Awards 2018 颁赠
-
荣获2018年埃及金融博览会颁赠
-
荣获 Shares Magazine 的 UK Forex Awards 2017 颁赠
-
荣获 World Finance Forex Awards 2017
-
2016年最佳黄金经纪商
-
2016年最佳外汇经纪商
-
2015年最佳本地客户服务
-
Global Brands Magazine 颁赠
-
Online Money Awards 2022 颁发
-
荣获2022年埃及金融博览会颁赠
-
2015最佳外汇交易平台
-
2015最佳金融交易平台
-
2013最佳创新外汇平台奖
-
2020年 Cyprus HR Awards 颁赠
-
金融行业的佼佼者
-
认证最优金牌级别
-
2014年首届亚军

Awarded BestBrokerYear After Year
CATEGORIES
News
- Chinese live lecture today's preview
- 8.12 Gold surges and falls back and closes, corrects over 60 intraday
- Gold 3400 is not the ultimate goal
- A collection of positive and negative news that affects the foreign exchange mar
- Gold is under pressure as scheduled, Europe and the United States first pay atte
market analysis
Gold is close to the 618 retracement level, and the resistance of European and American Japanese lines becomes the key
Wonderful introduction:
Life needs a smile. When you meet friends and relatives, you can give them a smile, which can inspire people's hearts and enhance friendships. When you receive help from strangers, you will feel xm-forex.comfortable with both parties; if you give yourself a smile, life will be better!
Hello everyone, today XM Foreign Exchange will bring you "[XM Foreign Exchange Platform]: Gold is close to the 618 retracement level, and the resistance of the European and American Japanese lines becomes the key." Hope it will be helpful to you! The original content is as follows:
Dollar Index
In terms of the performance of the US dollar index, the US dollar index showed a downward trend last Friday. The price of the US dollar index rose to 100.233 on the day, and fell to 98.581 on the lowest, and finally closed at 98.606. Looking back at the market performance last Friday, the price continued to fluctuate and rise in the short term during the early trading session, but from the overall perspective, the price diverged in one hour. After the subsequent non-agricultural data was released, the price fell sharply, and the price fell below the four-hour support. Then, the weekly support was tested again. We need to pay attention to the gains and losses of daily and weekly support in the future.
From a multi-cycle analysis, the 98.60 position is an important support at the weekly level, so from a medium-term perspective, the trend of the US dollar index is still relatively long before it actually broke. At the daily level, after the price broke through the daily resistance upward on July 28, the price continued to be more above the daily support. As time goes by, the daily support is currently in the 98.40 area, and the price is still relatively large above this position. From a four-hour perspective, the price fell below the four-hour support after the non-agricultural data was released last Friday, so in the short term, the price is bearish below the 99.40-50 range, and only if it breaks further will continue to rise. After the price has been under continuous pressure on Friday, it is currently showing a short-term correction. Therefore, before the price falls below the daily and weekly support, it is necessary to pay attention to the rebound. The gains and losses of the resistance in the next four hours will determine whether it can be further continued.
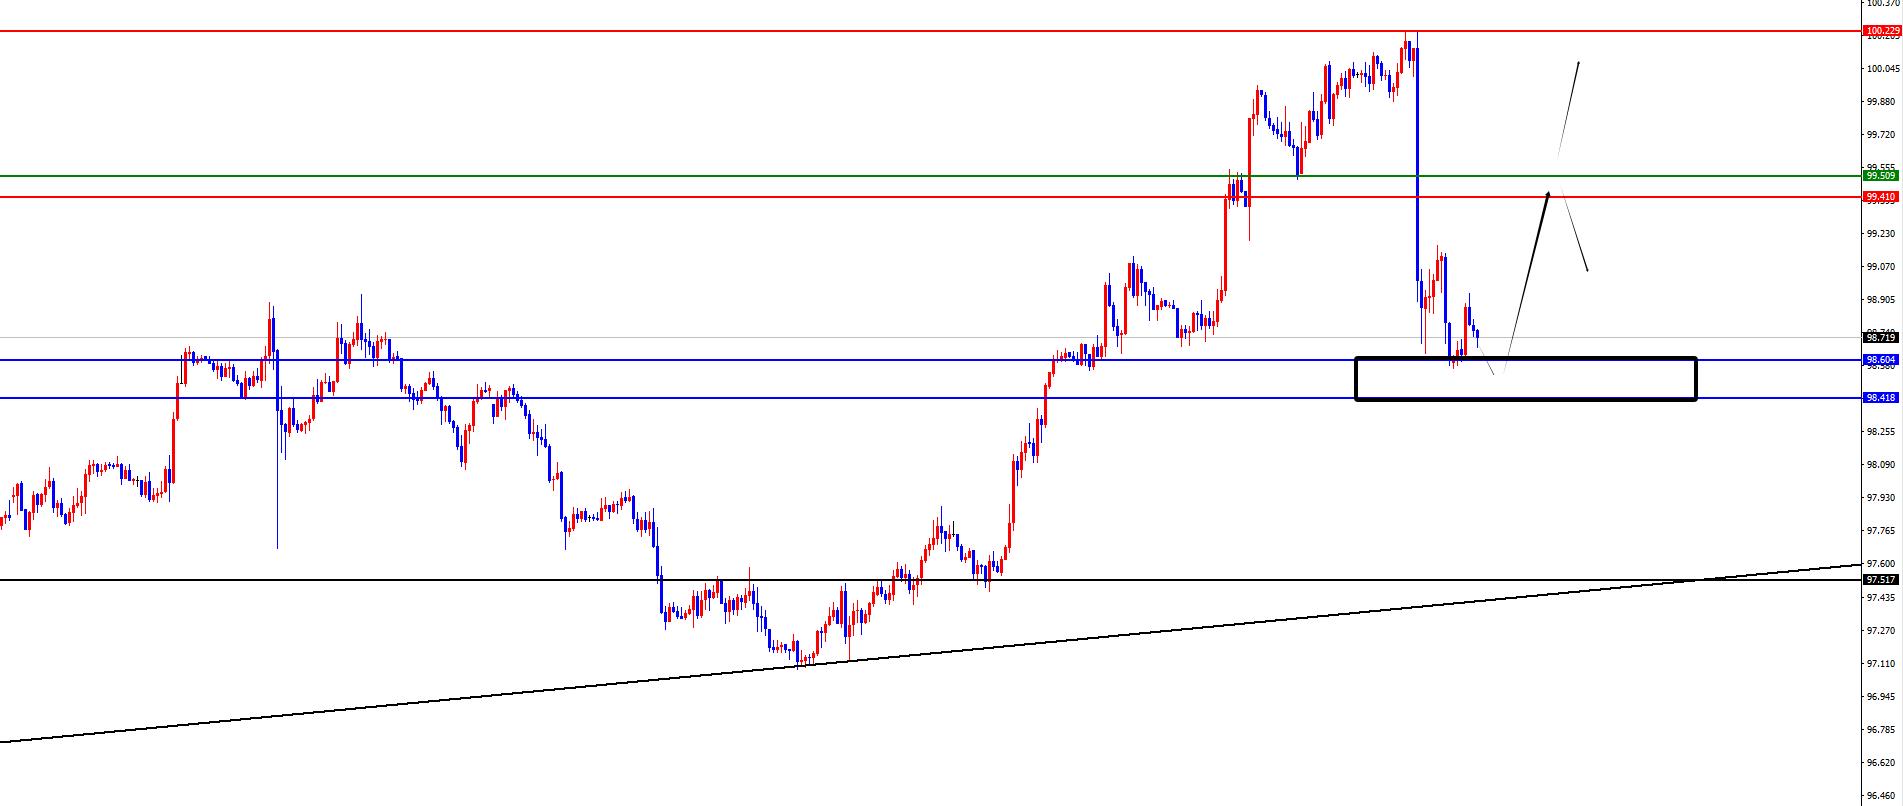
The US dollar index has a large range of 98.40-60, and the defense is 97.90, Target 99.10-99.50
Gold
In terms of gold, the gold price overall showed a sharp rise last Friday, with the highest price rising to 3363.23 on the day, falling to 3281.48 on the lowest price, closing at 3363 on the market. Last Friday, gold was under pressure at four-hour resistance during the early trading session, and then it stopped falling in the European session and broke the four-hour resistance level of 3301. At the same time, non-agricultural support in the US session rose sharply and closed at a high level on the same day.
From a multi-cycle analysis, first observe the monthly line rhythm. Prices have continued to fluctuate at high levels in recent months. The cross-end in the first few months was a weak bull market. In the final closing of July, it was considered against K. At the same time, the price has further pressure, so the monthly line is followed to pay attention to further suppression. From the weekly level, the weekly price has continued to fluctuate at a high level recently, rising and falling in the week on July 20, and at the same time, the price bottomed out and rebounded last week. Currently, we are temporarily paying attention to the gains and losses of the two-week high and low points. The weekly support is currently at 3335. According to the daily level, the price broke through the daily resistance last Friday, and the daily line is currently supported at 3348. At the same time, in the four-hour period, the US broke through the four-hour resistance before the trading session last Friday. After that, non-agricultural xm-forex.companies rose sharply based on the four-hour support. As time goes by, the four-hour support is currently in the range of 3320-3321, which is more than a high above this position. At the same time, the 3373-3374 above is the 618 position of the recent high of 3438.79 fell to the 3267 retracement. This position is an important resistance that needs to be paid attention to in the future. In one hour, with the sharp rise in prices last Friday, there is currently a pressure performance in one hour, but it is not recommended to layout this position for the time being. Focus on the resistance of the range of 3373-3374, and focus on the support of 3320 below. The subsequent price will only continue after the range is broken, otherwise we will pay attention to the oscillation for the time being.
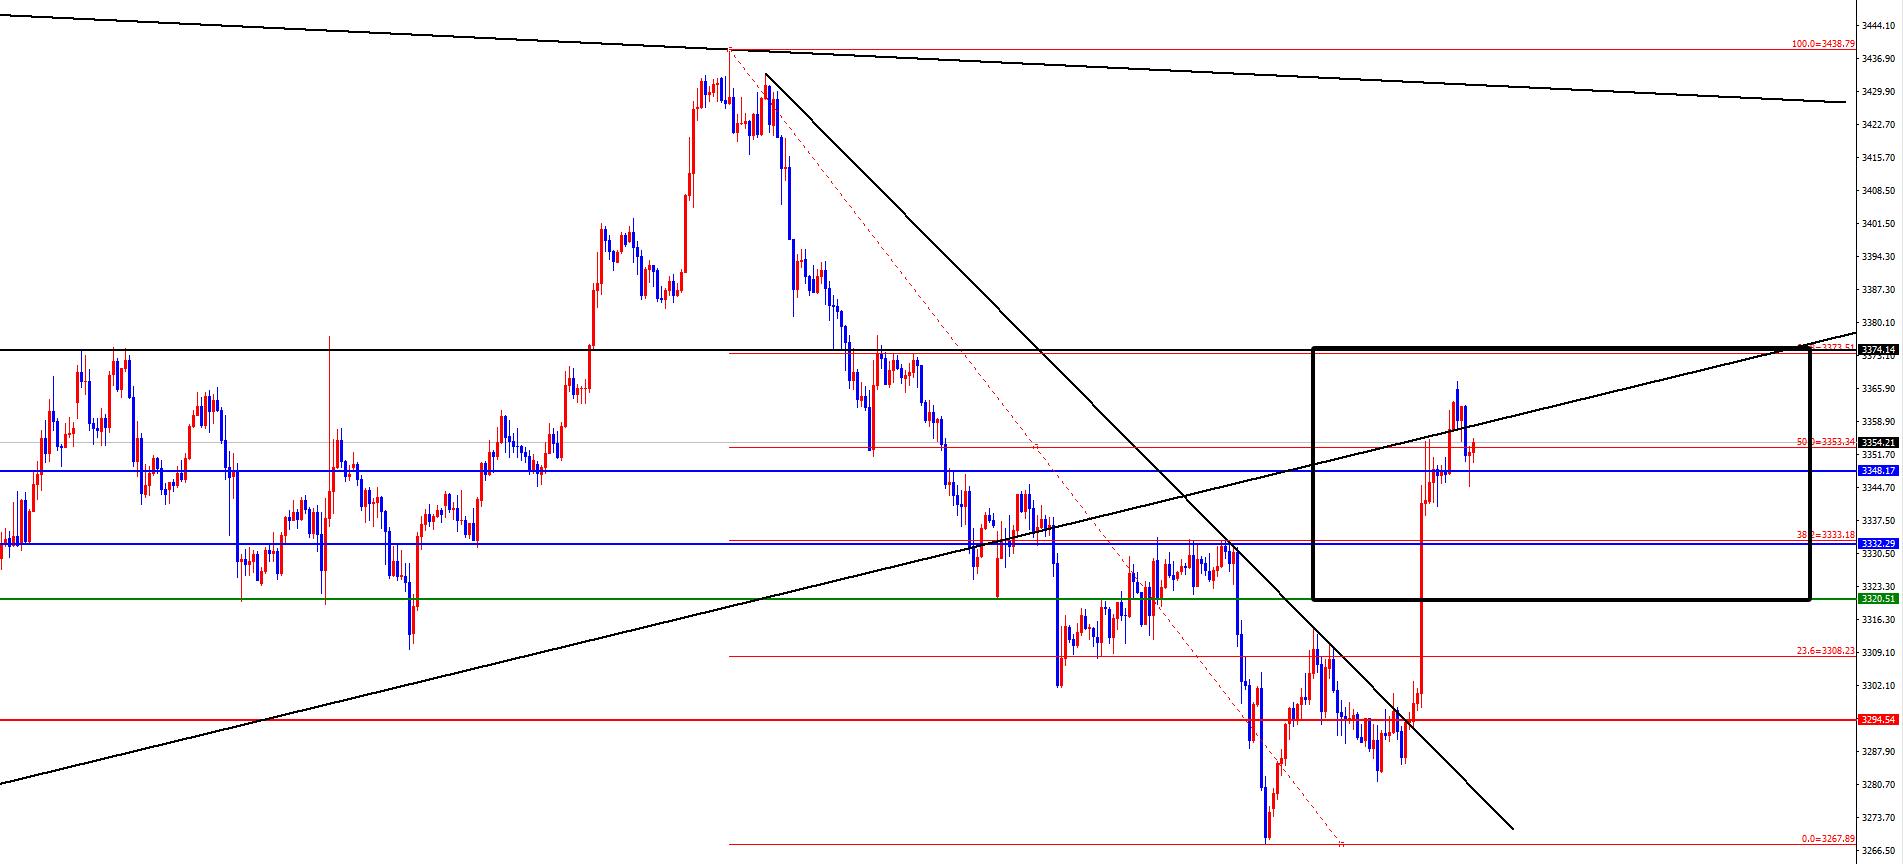
Gold focuses on the 3320-3374 range, sells high and buys low in the short term, and pays attention to the continuation after breaking the range
Europe and the United States
Europe and the United States
Europe and the United States, prices in Europe and the United States were generally on the rise last Friday. The price fell to 1.1391 at the lowest point on the day, and rose to 1.1596 at the highest point and closed at 1.1594 at the same time. Looking back at the performance of European and American markets last Friday, the price was under pressure during the early trading session and fluctuated with four-hour resistance. Then, after the non-agricultural data was released, it rose sharply, breaking the weekly resistance position upward, but it was still under pressure on the daily resistance. In the short term, we will temporarily focus on the four-hour support and daily resistance range, and then pay attention to the continuation after the breaking range.
From a multi-cycle analysis, from the perspective of the monthly line level, Europe and the United States are supported at 1.0980, so long-term bulls are still relatively large in the long term. The end of the monthly line in July is a big negative, which indicates that the price has adjusted. From the weekly level, the price broke the weekly support by 1.1490 last Wednesday, but it did not actually break down last week.We need to pay attention to the subsequent final closing performance in the future, and once the subsequent decline breaks and the medium-term decline begins. From the daily level, after falling below the daily support last week, the price currently continues to run below the daily resistance. As time goes by, the daily resistance is currently at the 1.1620 resistance. The price is still under pressure before breaking this position. From the four-hour level, the support in the range of 1.1490-1.1500 is relatively high above this position. The subsequent price will only be further under pressure after breaking. After the price rose sharply last Friday, the current price is currently facing daily resistance, and there is also a short-term pressure performance. Therefore, focus on the 1.1620-30 range for the time being, first look at the pressure, and then focus on the gains and losses of the four-hour support in the future. Once the subsequent break is broken, pay attention to the continued.
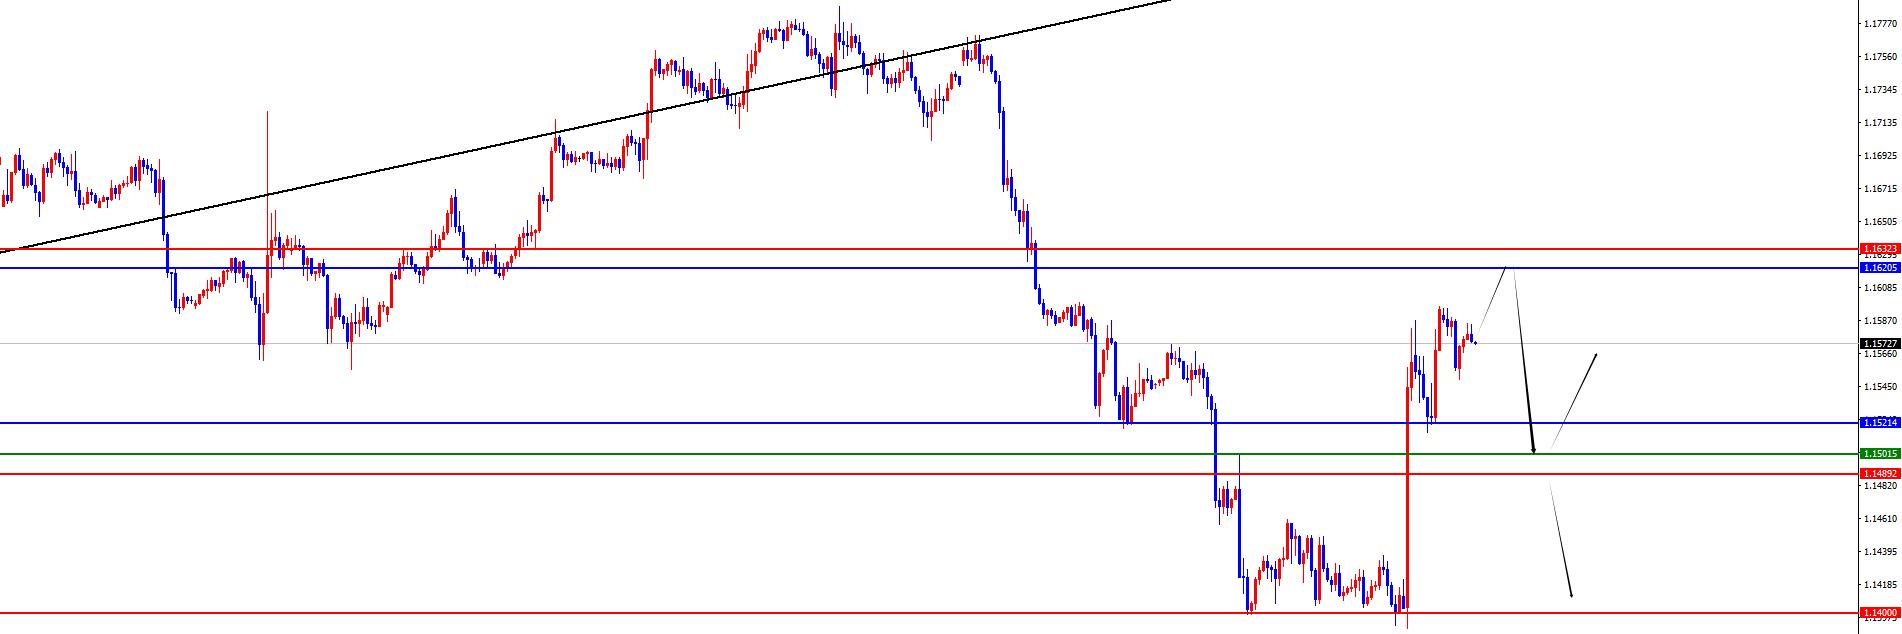
Europe and the United States have a short range of 1.1620-30, defense is 40 points, target 1.1520-1.1500
[Financial data and events that are focused today] Monday, August 4, 2025
①14:30 Swiss July CPI monthly rate
②16:30 Eurozone August Sentix Investor Confidence Index
③22:00 US June factory order monthly rate
Note: The above is only personal opinion and strategy, for reference and xm-forex.communication only, and does not give customers any investment advice. It has nothing to do with customers' investment, and is not used as a basis for ordering.
The above content is all about "[XM Foreign Exchange Platform]: Gold is close to the 618 retracement level, and the resistance of European and American Japanese lines becomes the key". It is carefully xm-forex.compiled and edited by the editor of XM Foreign Exchange. I hope it will be helpful to your trading! Thanks for the support!
Every successful person has a beginning. Only by having the courage to start can you find the way to success. Read the next article now!
Disclaimers: XM Group only provides execution services and access permissions for online trading platforms, and allows individuals to view and/or use the website or the content provided on the website, but has no intention of making any changes or extensions, nor will it change or extend its services and access permissions. All access and usage permissions will be subject to the following terms and conditions: (i) Terms and conditions; (ii) Risk warning; And (iii) a complete disclaimer. Please note that all information provided on the website is for general informational purposes only. In addition, the content of all XM online trading platforms does not constitute, and cannot be used for any unauthorized financial market trading invitations and/or invitations. Financial market transactions pose significant risks to your investment capital.
All materials published on online trading platforms are only intended for educational/informational purposes and do not include or should be considered for financial, investment tax, or trading related consulting and advice, or transaction price records, or any financial product or non invitation related trading offers or invitations.
All content provided by XM and third-party suppliers on this website, including opinions, news, research, analysis, prices, other information, and third-party website links, remains unchanged and is provided as general market commentary rather than investment advice. All materials published on online trading platforms are only for educational/informational purposes and do not include or should be considered as applicable to financial, investment tax, or trading related advice and recommendations, or transaction price records, or any financial product or non invitation related financial offers or invitations. Please ensure that you have read and fully understood the information on XM's non independent investment research tips and risk warnings. For more details, please click here