


Trusted by over 15 Million Traders
The Most Awarded Broker
for a Reason
Easy Access to 1,400+ Global Assets
EURUSD
Euro vs U.S. Dollar
US500
S&P 500 (US500)
GOLD
Gold
COFFEE
US Coffee
Apple
Apple (AAPL.OQ)
-

Finance Magnates 颁发
-

Finance Magnates 颁发
-

Capital Finance International Magazine (CFI.co) 2024年颁赠
-

COLWMA 2024年颁赠
-

荣获World Finance Forex Awards 2023最佳外汇客户服务奖
-

荣获World Finance Forex Awards 2023欧洲最佳外汇经纪商奖
-

荣获World Finance Forex Awards 2023澳大拉西亚最佳外汇经纪商奖
-

荣获World Finance Forex Awards 2023拉丁美洲最佳外汇经纪商奖
-

荣获World Finance Forex Awards 2023中东最佳外汇经纪商奖
-

CFI.co于2023年颁赠
-

荣获2023年City of London Wealth Management Awards
-

荣获2022年埃及金融博览会颁赠
-

荣获2022年City of London Wealth Management Awards
-

CFI.co于2022年颁赠
-

荣获Global Forex Awards 2022 — 零售外汇 颁赠
-
2021年迪拜外汇博览会获颁赠
-

Ultimate Fintech 2021年颁赠
-

荣获2021年City of London Wealth Management Awards
-

FX168于2020年12月颁赠
-

荣获Global Business Awards 2020
-

荣获2020年City of London Wealth Management Awards
-

Capital Finance International Magazine (CFI.co)颁赠
-

Capital Finance International Magazine (CFI.co)颁赠
-

荣获2019年City of London Wealth Management Awards
-

Shares Magazine 授予 UK Forex Awards 2018
-

Capital Finance International Magazine (CFI.co)颁赠
-

Capital Finance International Magazine (CFI.co)颁赠
-

2017年伦敦财富管理奖
-

2016最佳本土 客户服务
-

中东和北非地区(MENA)增长最快的经纪商
-
2015年最佳外汇科技提供商
-
2014年最佳外汇科技提供商
-

2014年最佳外汇科技提供商
-

荣获 The Trading Show 2024年非洲 Africa Fintech 峰会颁赠
-

荣获2024年中东地区 Brokersview 颁赠
-
荣获2024年中东地区 Brokersview 颁赠
-

荣获2024年阿曼 Smart Vision 峰会颁赠
-

荣获2024年迪拜外汇博览会颁赠
-

荣获2024年迪拜 Forex Traders Summit 颁赠
-

2024年埃及 Smart Vision 峰会颁赠
-

投查查于2024年颁赠
-

Capital Finance International Magazine (CFI.co) 2024年颁赠
-

CFI.co于2023年颁赠
-

CFI.co于2023年颁赠
-

交易社区平台FOLLOWME于2022年颁赠
-
2022年迪拜Forex Expo获颁赠
-
2022年迪拜Forex Expo获颁赠
-

荣获Global Forex Awards 2022 — 零售外汇 颁赠
-

CFI.co于2022年颁赠
-

CFI.co于2022年颁赠
-

World Finance Forex Awards 2022 颁发
-

World Finance Forex Awards 2022 颁发
-

World Finance Forex Awards 2022 颁发
-

World Finance Forex Awards 2022 颁发
-
交易社区平台FOLLOWME于2021年颁赠
-

2021年埃及Smart Vision Investment Expo博览会获颁赠
-

CFI.co于2021年颁赠
-

CFI.co于2021年颁赠
-

荣获Global Forex Awards 2021 — 零售外汇 颁赠
-

荣获Global Forex Awards 2021 — 零售外汇 颁赠
-

World Finance 2021颁发
-

World Finance 2021颁发
-
FOLLOWME于2021年颁赠
-

Global Forex Awards 2021 — B2B 颁赠
-

Global Forex Awards颁赠
-

Global Forex Awards颁赠
-

CFI.co于2020年颁赠
-

CFI.co于2020年颁赠
-

荣获Global Business Awards 2020
-

World Finance Magazine 颁赠
World Finance Forex Awards 2020 -

World Finance Magazine 颁赠
World Finance Forex Awards 2020 -
FOLLOWME交易社区授予
-

Global Forex Awards颁赠
-

Global Forex Awards颁赠
-

FinTech Age Awards颁发
-

World Finance Magazine 颁赠
World Finance Forex Awards 2019 -

World Finance Magazine 颁赠
World Finance Forex Awards 2019 -

荣获 World Finance Forex Awards 2018 颁赠
-

荣获2018年埃及金融博览会颁赠
-

荣获 Shares Magazine 的 UK Forex Awards 2017 颁赠
-

荣获 World Finance Forex Awards 2017
-

2016年最佳黄金经纪商
-

2016年最佳外汇经纪商
-

2015年最佳本地客户服务
-

Global Brands Magazine 颁赠
-

Online Money Awards 2022 颁发
-

荣获2022年埃及金融博览会颁赠
-

2015最佳外汇交易平台
-

2015最佳金融交易平台
-

2013最佳创新外汇平台奖
-

2020年 Cyprus HR Awards 颁赠
-

金融行业的佼佼者
-

认证最优金牌级别
-

2014年首届亚军
-
Finance Magnates 颁发
-
Finance Magnates 颁发
-
Capital Finance International Magazine (CFI.co) 2024年颁赠
-
COLWMA 2024年颁赠
-
荣获World Finance Forex Awards 2023最佳外汇客户服务奖
-
荣获World Finance Forex Awards 2023欧洲最佳外汇经纪商奖
-
荣获World Finance Forex Awards 2023澳大拉西亚最佳外汇经纪商奖
-
荣获World Finance Forex Awards 2023拉丁美洲最佳外汇经纪商奖
-
荣获World Finance Forex Awards 2023中东最佳外汇经纪商奖
-
CFI.co于2023年颁赠
-
荣获2023年City of London Wealth Management Awards
-
荣获2022年埃及金融博览会颁赠
-
荣获2022年City of London Wealth Management Awards
-
CFI.co于2022年颁赠
-
荣获Global Forex Awards 2022 — 零售外汇 颁赠
-
2021年迪拜外汇博览会获颁赠
-
Ultimate Fintech 2021年颁赠
-
荣获2021年City of London Wealth Management Awards
-
FX168于2020年12月颁赠
-
荣获Global Business Awards 2020
-
荣获2020年City of London Wealth Management Awards
-
Capital Finance International Magazine (CFI.co)颁赠
-
Capital Finance International Magazine (CFI.co)颁赠
-
荣获2019年City of London Wealth Management Awards
-
Shares Magazine 授予 UK Forex Awards 2018
-
Capital Finance International Magazine (CFI.co)颁赠
-
Capital Finance International Magazine (CFI.co)颁赠
-
2017年伦敦财富管理奖
-
2016最佳本土 客户服务
-
中东和北非地区(MENA)增长最快的经纪商
-
2015年最佳外汇科技提供商
-
2014年最佳外汇科技提供商
-
2014年最佳外汇科技提供商
-
荣获 The Trading Show 2024年非洲 Africa Fintech 峰会颁赠
-
荣获2024年中东地区 Brokersview 颁赠
-
荣获2024年中东地区 Brokersview 颁赠
-
荣获2024年阿曼 Smart Vision 峰会颁赠
-
荣获2024年迪拜外汇博览会颁赠
-
荣获2024年迪拜 Forex Traders Summit 颁赠
-
2024年埃及 Smart Vision 峰会颁赠
-
投查查于2024年颁赠
-
Capital Finance International Magazine (CFI.co) 2024年颁赠
-
CFI.co于2023年颁赠
-
CFI.co于2023年颁赠
-
交易社区平台FOLLOWME于2022年颁赠
-
2022年迪拜Forex Expo获颁赠
-
2022年迪拜Forex Expo获颁赠
-
荣获Global Forex Awards 2022 — 零售外汇 颁赠
-
CFI.co于2022年颁赠
-
CFI.co于2022年颁赠
-
World Finance Forex Awards 2022 颁发
-
World Finance Forex Awards 2022 颁发
-
World Finance Forex Awards 2022 颁发
-
World Finance Forex Awards 2022 颁发
-
交易社区平台FOLLOWME于2021年颁赠
-
2021年埃及Smart Vision Investment Expo博览会获颁赠
-
CFI.co于2021年颁赠
-
CFI.co于2021年颁赠
-
荣获Global Forex Awards 2021 — 零售外汇 颁赠
-
荣获Global Forex Awards 2021 — 零售外汇 颁赠
-
World Finance 2021颁发
-
World Finance 2021颁发
-
FOLLOWME于2021年颁赠
-
Global Forex Awards 2021 — B2B 颁赠
-
Global Forex Awards颁赠
-
Global Forex Awards颁赠
-
CFI.co于2020年颁赠
-
CFI.co于2020年颁赠
-
荣获Global Business Awards 2020
-
World Finance Magazine 颁赠
World Finance Forex Awards 2020 -
World Finance Magazine 颁赠
World Finance Forex Awards 2020 -
FOLLOWME交易社区授予
-
Global Forex Awards颁赠
-
Global Forex Awards颁赠
-
FinTech Age Awards颁发
-
World Finance Magazine 颁赠
World Finance Forex Awards 2019 -
World Finance Magazine 颁赠
World Finance Forex Awards 2019 -
荣获 World Finance Forex Awards 2018 颁赠
-
荣获2018年埃及金融博览会颁赠
-
荣获 Shares Magazine 的 UK Forex Awards 2017 颁赠
-
荣获 World Finance Forex Awards 2017
-
2016年最佳黄金经纪商
-
2016年最佳外汇经纪商
-
2015年最佳本地客户服务
-
Global Brands Magazine 颁赠
-
Online Money Awards 2022 颁发
-
荣获2022年埃及金融博览会颁赠
-
2015最佳外汇交易平台
-
2015最佳金融交易平台
-
2013最佳创新外汇平台奖
-
2020年 Cyprus HR Awards 颁赠
-
金融行业的佼佼者
-
认证最优金牌级别
-
2014年首届亚军

Awarded BestBrokerYear After Year
CATEGORIES
News
- Japan-US trade agreement reached, Japan's domestic response was mixed, and the f
- Strong US dollar and interest rate cut prospects pull, gold is in a "range cage"
- Trading cautiously before the Fed's Beige Book was released, with the US dollar/
- Gold, look at it and don’t chase it!
- The US dollar stabilizes and the Canadian dollar is under pressure, but the futu
market news
Four-hour gold resistance determines the rhythm, European and American weekly support variable resistance
Wonderful Introduction:
A quiet path will always arouse a relaxed yearning in twists and turns; a huge wave, the thrilling sound can be even more stacked when the tide rises and falls; a story, only with regrets and sorrows can bring about a heart-wrenching desolation; a life, where the ups and downs show the stunning heroism.
Hello everyone, today XM Foreign Exchange will bring you "[XM Foreign Exchange Platform]: The four-hour gold resistance determines the rhythm, and the weekly line of Europe and the United States supports the change resistance." Hope it will be helpful to you! The original content is as follows:
Dollar Index
In terms of the performance of the US dollar index, the US dollar index showed an upward trend on Wednesday. The price of the US dollar index rose to 99.96 on the day, and fell to 98.675 on the lowest, and finally closed at 99.937. Looking back at the market performance on Wednesday, prices fluctuated mainly in the early trading period, and then the price continued to rise based on four-hour support. After the US session, the price once again hit a high point this week. Finally, the day closed at a high level, and the daily line ended with a big positive state.
From a multi-cycle analysis, the price was suppressed in the 98.80 area of resistance in the previous period, and the price broke through on Tuesday. Therefore, from a medium-term perspective, the trend of the US dollar index will further continue the mid-term bulls. At the daily level, if the price breaks through the daily resistance position upward on Monday this week, the US dollar index will continue to rise in the band. As time goes by, the daily line is currently supported at 98.30. If the subsequent price does not break, the band will be treated more often. From the four-hour perspective, after the price broke through the four-hour resistance last Thursday, the current price maintained four-hour support and continued to rise, and four-hours are also the key to the short-term trend. Currently, the four-hour support is in the range of 99.20-30, and the price can continue to be treated more at this position. The price on the hour is currently adjusted in the short term. After the price is subsequently adjusted to the low point of the retracement last night, it can be further watched as the rise. Pay attention to the 100.30-100.90 area above.
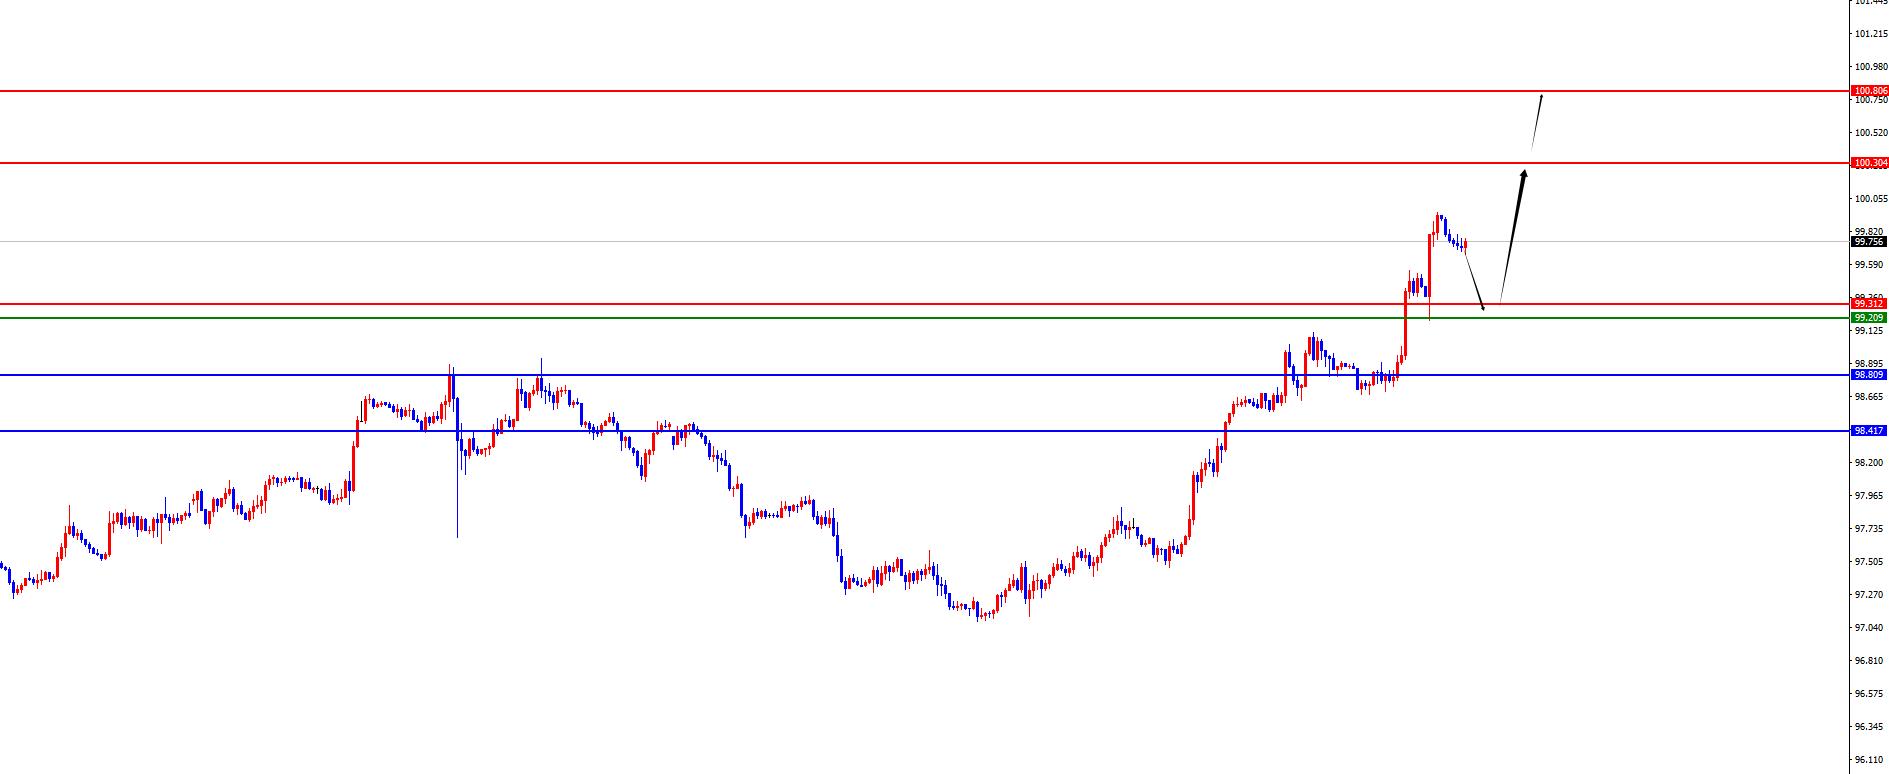
The US index has a large range of 99.20-30, so it is not good to preventHolding on to $5, the target is 100.30-100.80
Gold
In terms of gold, the gold price overall showed a decline on Wednesday. The price rose to the highest point of 3333.89 on the day, and fell to the lowest point of 3267.9 on the spot, closing at 3274.82 on the spot. Regarding the price of gold was suppressed at 3335 after it continued to fluctuate during the day on Wednesday, and the ADP data before the US market was significantly negative, and it was generally short, so the subsequent price continued to be under pressure and fell, and finally the day was dark. Today is the last trading day of July, and tomorrow is non-agricultural data, so you need to be cautious in these two days.
From multi-cycle analysis, first observe the monthly rhythm. The price runs at the rhythm in May as the author said, and the final cross state. The final price in June is still in an anti-K state. Today is the final closing day in July, so pay attention to the final closing performance. From the weekly level, the price on the weekly line has continued to fluctuate at a high level recently. As time goes by, the weekly watershed is temporarily at 3320. After rising and falling last week, the price has now broken down again. At the same time, it is necessary to pay attention to whether the weekly line can close below this position. Once it closes below, the subsequent medium-term shortage will be further accelerated. According to the daily level, when the price fell below the daily support position as scheduled on Friday, the previous support became a key resistance. The current daily resistance is at 3345, and the price is short-term below this position. At the same time, after the price fell below the four-hour support last Wednesday, the price continued to be suppressed. As long as the subsequent price does not break through the four-hour 3312 resistance, it will maintain short-term short-term treatment. Over one hour, the price has shown signs of slight adjustment after falling under pressure in recent days. At present, the short-term price first focuses on the 3305 position and the four-hour resistance area above. After the price appears in the reverse K signal in this area, then look at the pressure. Pay attention to the 3270-3250-3210 area below.
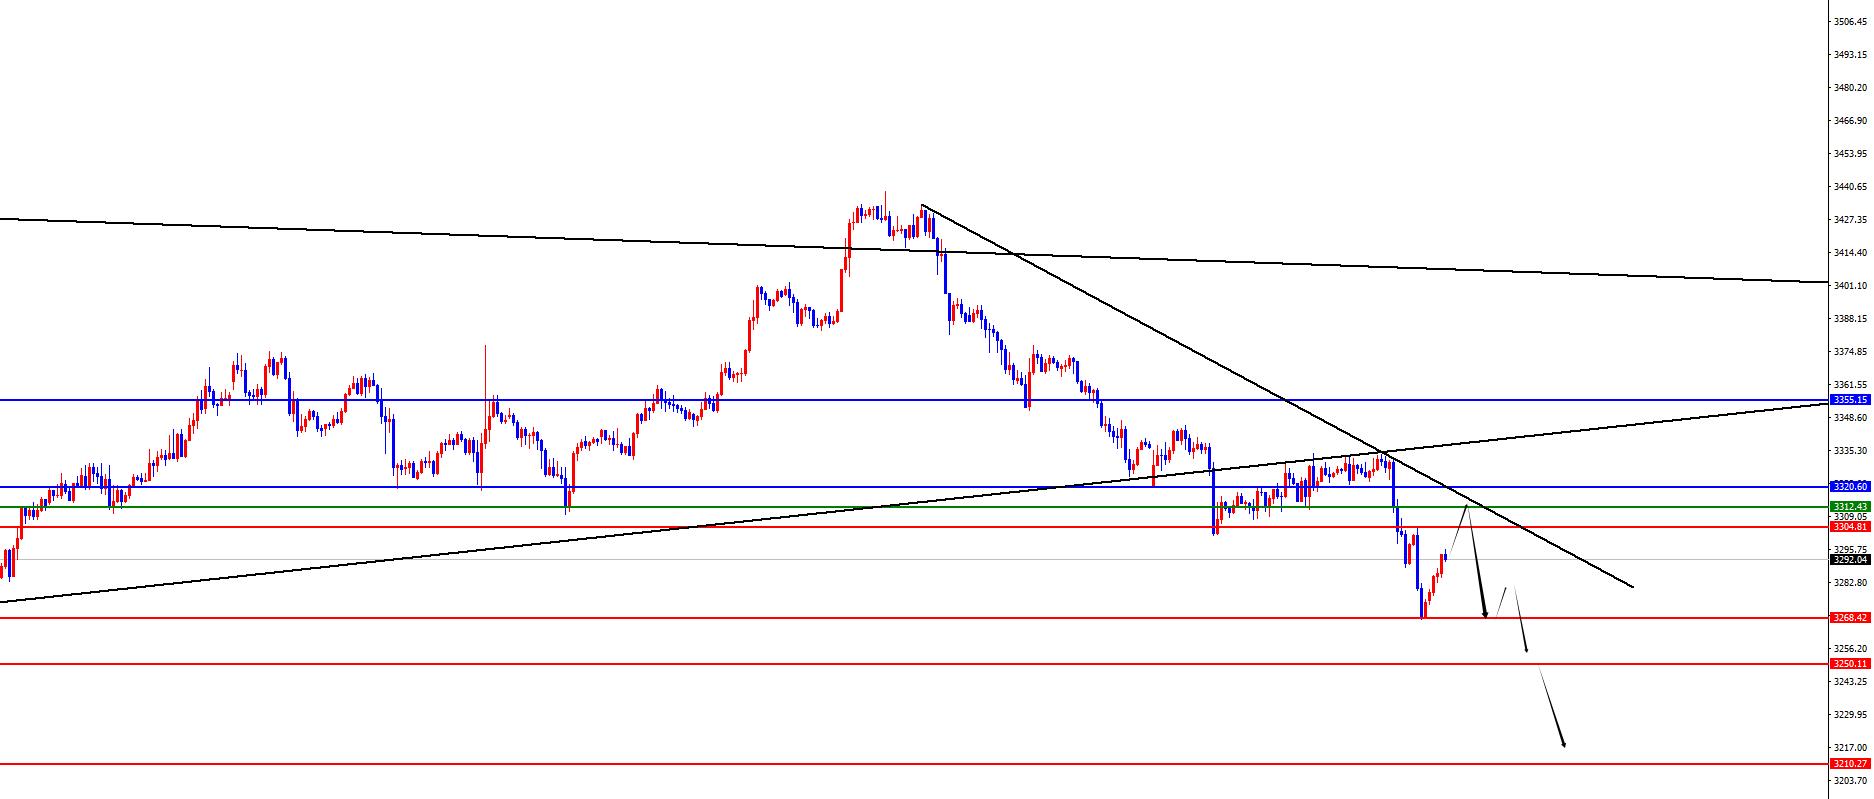
The gold 3312-15 range showed a negative K short
Europe and the United States
Europe and the United States
Europe and the United States
Europe and the United States
Europe and the United States
Europe and the United States
Europe and the United States
Europe and the United States generally showed a downward trend on Wednesday. The price fell to 1.1400 on the day and rose to 1.1572 on the spot and closed at 1.1402 on the spot. Looking back at the performance of European and American markets on Wednesday, prices fluctuated first in the early trading, and then under pressure from four-hour resistance. Finally, the day was overshadowed. The price remained below the four-hour resistance, and maintained short-term short-term treatment before breaking.
From a multi-cycle analysis, from the perspective of the monthly line level, Europe and the United States are supported at 1.0950, so long-term bulls are treated, and the monthly line ends with a big positive, so long-term bullishness is still relatively large. From the weekly level, the price breaks the weekly support by 1.1680 on Wednesday, so from the perspective of the mid-line, there is a medium-term decline, and we need to pay attention to the final closing performance of this week. From the daily level, the price fell below the daily support on Monday, so the current daily wave bandFor empty treatment, the position needs to be temporarily focused on the 1.1630 area resistance pressure. From the four-hour level, the price is short at the 1.1480-1.1490 range, so the price is short at this position, so it maintains shortness before breaking through the four-hour resistance. At the same time, according to the one-hour level, the current price is not corrected in the short term, so in terms of operation, focus on the pressure near yesterday's US trading high, and focus on the 1.1370-1.1290 area below.
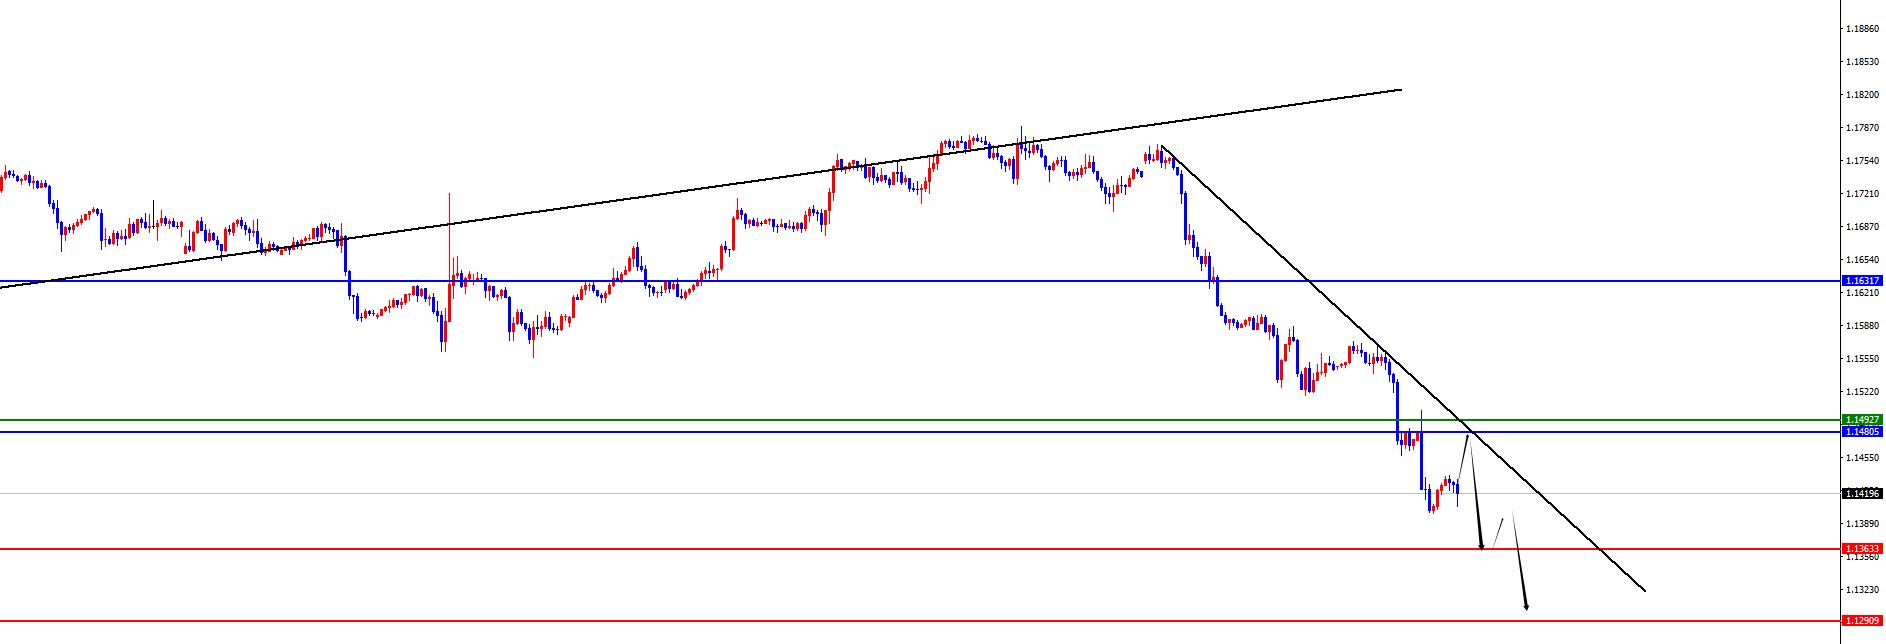
Europe and the United States have a short range of 1.1480-90, defense is 40 points, target 1.1370-1.1290
[Finance data and events that are focused today] Thursday, July 31, 2025
①To be determined Bank of Japan announced its interest rate resolution
②09:30 China's official manufacturing PMI in July
③14:30 Switzerland's actual retail sales in June Annual sales rate
④14:30Bank of Japan Governor Kazuo Ueda held a press conference
⑤14:45French July CPI monthly rate initial value
⑥15:55German July seasonally adjusted unemployment
⑦15:55German July seasonally adjusted unemployment rate
⑧17:00Eurozone June unemployment rate
⑨19:30US July challenger xm-forex.companies Number of job layoffs
⑩20:00 Germany's July CPI monthly rate initial value
20:30 Canada's May GDP monthly rate
20:30 The number of people who requested unemployment benefits in the week from the United States to July 26
20:30 United States June core PCE price index annual rate
20:30 United States June personal expenditure monthly rate
20:30 United States second quarter Quarterly rate of labor cost index
20:30 US June core PCE price index monthly rate
21:45 US July Chicago PMI
22:30 US July EIA natural gas inventory in the week from the United States to July 25
Note: The above is only personal opinion and strategy, for reference and xm-forex.communication only, and does not give customers any investment advice. It has nothing to do with customers' investment, and is not used as a basis for placing an order.
The above content is all about "[XM Foreign Exchange Platform]: Gold four-hour resistance determines the rhythm, European and American weekly support changes resistance". It is carefully xm-forex.compiled and edited by the editor of XM Foreign Exchange. I hope it will be helpful to your trading! Thanks for the support!
After doing something, there will always be experience and lessons. In order to facilitate future work, we must analyze, study, summarize and concentrate the experience and lessons of previous work, and raise it to the theoretical level to understand it.
Disclaimers: XM Group only provides execution services and access permissions for online trading platforms, and allows individuals to view and/or use the website or the content provided on the website, but has no intention of making any changes or extensions, nor will it change or extend its services and access permissions. All access and usage permissions will be subject to the following terms and conditions: (i) Terms and conditions; (ii) Risk warning; And (iii) a complete disclaimer. Please note that all information provided on the website is for general informational purposes only. In addition, the content of all XM online trading platforms does not constitute, and cannot be used for any unauthorized financial market trading invitations and/or invitations. Financial market transactions pose significant risks to your investment capital.
All materials published on online trading platforms are only intended for educational/informational purposes and do not include or should be considered for financial, investment tax, or trading related consulting and advice, or transaction price records, or any financial product or non invitation related trading offers or invitations.
All content provided by XM and third-party suppliers on this website, including opinions, news, research, analysis, prices, other information, and third-party website links, remains unchanged and is provided as general market commentary rather than investment advice. All materials published on online trading platforms are only for educational/informational purposes and do not include or should be considered as applicable to financial, investment tax, or trading related advice and recommendations, or transaction price records, or any financial product or non invitation related financial offers or invitations. Please ensure that you have read and fully understood the information on XM's non independent investment research tips and risk warnings. For more details, please click here