


Trusted by over 15 Million Traders
The Most Awarded Broker
for a Reason
Easy Access to 1,400+ Global Assets
EURUSD
Euro vs U.S. Dollar
US500
S&P 500 (US500)
GOLD
Gold
COFFEE
US Coffee
Apple
Apple (AAPL.OQ)
-

Finance Magnates 颁发
-

Finance Magnates 颁发
-

Capital Finance International Magazine (CFI.co) 2024年颁赠
-

COLWMA 2024年颁赠
-

荣获World Finance Forex Awards 2023最佳外汇客户服务奖
-

荣获World Finance Forex Awards 2023欧洲最佳外汇经纪商奖
-

荣获World Finance Forex Awards 2023澳大拉西亚最佳外汇经纪商奖
-

荣获World Finance Forex Awards 2023拉丁美洲最佳外汇经纪商奖
-

荣获World Finance Forex Awards 2023中东最佳外汇经纪商奖
-

CFI.co于2023年颁赠
-

荣获2023年City of London Wealth Management Awards
-

荣获2022年埃及金融博览会颁赠
-

荣获2022年City of London Wealth Management Awards
-

CFI.co于2022年颁赠
-

荣获Global Forex Awards 2022 — 零售外汇 颁赠
-
2021年迪拜外汇博览会获颁赠
-

Ultimate Fintech 2021年颁赠
-

荣获2021年City of London Wealth Management Awards
-

FX168于2020年12月颁赠
-

荣获Global Business Awards 2020
-

荣获2020年City of London Wealth Management Awards
-

Capital Finance International Magazine (CFI.co)颁赠
-

Capital Finance International Magazine (CFI.co)颁赠
-

荣获2019年City of London Wealth Management Awards
-

Shares Magazine 授予 UK Forex Awards 2018
-

Capital Finance International Magazine (CFI.co)颁赠
-

Capital Finance International Magazine (CFI.co)颁赠
-

2017年伦敦财富管理奖
-

2016最佳本土 客户服务
-

中东和北非地区(MENA)增长最快的经纪商
-
2015年最佳外汇科技提供商
-
2014年最佳外汇科技提供商
-

2014年最佳外汇科技提供商
-

荣获 The Trading Show 2024年非洲 Africa Fintech 峰会颁赠
-

荣获2024年中东地区 Brokersview 颁赠
-
荣获2024年中东地区 Brokersview 颁赠
-

荣获2024年阿曼 Smart Vision 峰会颁赠
-

荣获2024年迪拜外汇博览会颁赠
-

荣获2024年迪拜 Forex Traders Summit 颁赠
-

2024年埃及 Smart Vision 峰会颁赠
-

投查查于2024年颁赠
-

Capital Finance International Magazine (CFI.co) 2024年颁赠
-

CFI.co于2023年颁赠
-

CFI.co于2023年颁赠
-

交易社区平台FOLLOWME于2022年颁赠
-
2022年迪拜Forex Expo获颁赠
-
2022年迪拜Forex Expo获颁赠
-

荣获Global Forex Awards 2022 — 零售外汇 颁赠
-

CFI.co于2022年颁赠
-

CFI.co于2022年颁赠
-

World Finance Forex Awards 2022 颁发
-

World Finance Forex Awards 2022 颁发
-

World Finance Forex Awards 2022 颁发
-

World Finance Forex Awards 2022 颁发
-
交易社区平台FOLLOWME于2021年颁赠
-

2021年埃及Smart Vision Investment Expo博览会获颁赠
-

CFI.co于2021年颁赠
-

CFI.co于2021年颁赠
-

荣获Global Forex Awards 2021 — 零售外汇 颁赠
-

荣获Global Forex Awards 2021 — 零售外汇 颁赠
-

World Finance 2021颁发
-

World Finance 2021颁发
-
FOLLOWME于2021年颁赠
-

Global Forex Awards 2021 — B2B 颁赠
-

Global Forex Awards颁赠
-

Global Forex Awards颁赠
-

CFI.co于2020年颁赠
-

CFI.co于2020年颁赠
-

荣获Global Business Awards 2020
-

World Finance Magazine 颁赠
World Finance Forex Awards 2020 -

World Finance Magazine 颁赠
World Finance Forex Awards 2020 -
FOLLOWME交易社区授予
-

Global Forex Awards颁赠
-

Global Forex Awards颁赠
-

FinTech Age Awards颁发
-

World Finance Magazine 颁赠
World Finance Forex Awards 2019 -

World Finance Magazine 颁赠
World Finance Forex Awards 2019 -

荣获 World Finance Forex Awards 2018 颁赠
-

荣获2018年埃及金融博览会颁赠
-

荣获 Shares Magazine 的 UK Forex Awards 2017 颁赠
-

荣获 World Finance Forex Awards 2017
-

2016年最佳黄金经纪商
-

2016年最佳外汇经纪商
-

2015年最佳本地客户服务
-

Global Brands Magazine 颁赠
-

Online Money Awards 2022 颁发
-

荣获2022年埃及金融博览会颁赠
-

2015最佳外汇交易平台
-

2015最佳金融交易平台
-

2013最佳创新外汇平台奖
-

2020年 Cyprus HR Awards 颁赠
-

金融行业的佼佼者
-

认证最优金牌级别
-

2014年首届亚军
-
Finance Magnates 颁发
-
Finance Magnates 颁发
-
Capital Finance International Magazine (CFI.co) 2024年颁赠
-
COLWMA 2024年颁赠
-
荣获World Finance Forex Awards 2023最佳外汇客户服务奖
-
荣获World Finance Forex Awards 2023欧洲最佳外汇经纪商奖
-
荣获World Finance Forex Awards 2023澳大拉西亚最佳外汇经纪商奖
-
荣获World Finance Forex Awards 2023拉丁美洲最佳外汇经纪商奖
-
荣获World Finance Forex Awards 2023中东最佳外汇经纪商奖
-
CFI.co于2023年颁赠
-
荣获2023年City of London Wealth Management Awards
-
荣获2022年埃及金融博览会颁赠
-
荣获2022年City of London Wealth Management Awards
-
CFI.co于2022年颁赠
-
荣获Global Forex Awards 2022 — 零售外汇 颁赠
-
2021年迪拜外汇博览会获颁赠
-
Ultimate Fintech 2021年颁赠
-
荣获2021年City of London Wealth Management Awards
-
FX168于2020年12月颁赠
-
荣获Global Business Awards 2020
-
荣获2020年City of London Wealth Management Awards
-
Capital Finance International Magazine (CFI.co)颁赠
-
Capital Finance International Magazine (CFI.co)颁赠
-
荣获2019年City of London Wealth Management Awards
-
Shares Magazine 授予 UK Forex Awards 2018
-
Capital Finance International Magazine (CFI.co)颁赠
-
Capital Finance International Magazine (CFI.co)颁赠
-
2017年伦敦财富管理奖
-
2016最佳本土 客户服务
-
中东和北非地区(MENA)增长最快的经纪商
-
2015年最佳外汇科技提供商
-
2014年最佳外汇科技提供商
-
2014年最佳外汇科技提供商
-
荣获 The Trading Show 2024年非洲 Africa Fintech 峰会颁赠
-
荣获2024年中东地区 Brokersview 颁赠
-
荣获2024年中东地区 Brokersview 颁赠
-
荣获2024年阿曼 Smart Vision 峰会颁赠
-
荣获2024年迪拜外汇博览会颁赠
-
荣获2024年迪拜 Forex Traders Summit 颁赠
-
2024年埃及 Smart Vision 峰会颁赠
-
投查查于2024年颁赠
-
Capital Finance International Magazine (CFI.co) 2024年颁赠
-
CFI.co于2023年颁赠
-
CFI.co于2023年颁赠
-
交易社区平台FOLLOWME于2022年颁赠
-
2022年迪拜Forex Expo获颁赠
-
2022年迪拜Forex Expo获颁赠
-
荣获Global Forex Awards 2022 — 零售外汇 颁赠
-
CFI.co于2022年颁赠
-
CFI.co于2022年颁赠
-
World Finance Forex Awards 2022 颁发
-
World Finance Forex Awards 2022 颁发
-
World Finance Forex Awards 2022 颁发
-
World Finance Forex Awards 2022 颁发
-
交易社区平台FOLLOWME于2021年颁赠
-
2021年埃及Smart Vision Investment Expo博览会获颁赠
-
CFI.co于2021年颁赠
-
CFI.co于2021年颁赠
-
荣获Global Forex Awards 2021 — 零售外汇 颁赠
-
荣获Global Forex Awards 2021 — 零售外汇 颁赠
-
World Finance 2021颁发
-
World Finance 2021颁发
-
FOLLOWME于2021年颁赠
-
Global Forex Awards 2021 — B2B 颁赠
-
Global Forex Awards颁赠
-
Global Forex Awards颁赠
-
CFI.co于2020年颁赠
-
CFI.co于2020年颁赠
-
荣获Global Business Awards 2020
-
World Finance Magazine 颁赠
World Finance Forex Awards 2020 -
World Finance Magazine 颁赠
World Finance Forex Awards 2020 -
FOLLOWME交易社区授予
-
Global Forex Awards颁赠
-
Global Forex Awards颁赠
-
FinTech Age Awards颁发
-
World Finance Magazine 颁赠
World Finance Forex Awards 2019 -
World Finance Magazine 颁赠
World Finance Forex Awards 2019 -
荣获 World Finance Forex Awards 2018 颁赠
-
荣获2018年埃及金融博览会颁赠
-
荣获 Shares Magazine 的 UK Forex Awards 2017 颁赠
-
荣获 World Finance Forex Awards 2017
-
2016年最佳黄金经纪商
-
2016年最佳外汇经纪商
-
2015年最佳本地客户服务
-
Global Brands Magazine 颁赠
-
Online Money Awards 2022 颁发
-
荣获2022年埃及金融博览会颁赠
-
2015最佳外汇交易平台
-
2015最佳金融交易平台
-
2013最佳创新外汇平台奖
-
2020年 Cyprus HR Awards 颁赠
-
金融行业的佼佼者
-
认证最优金牌级别
-
2014年首届亚军

Awarded BestBrokerYear After Year
CATEGORIES
News
- 【XM Decision Analysis】--AUD/USD Forex Signal: Forecast Ahead of Fed Decision, Au
- 【XM Forex】--ETH/USD Forecast: Ethereum Holds Support
- 【XM Forex】--USD/ZAR Monthly Forecast: February 2025
- 【XM Decision Analysis】--USD/CAD Forecast: Canadian Dollar Continues to Fall Apar
- 【XM Market Analysis】--EUR/USD Forex Signal: Reluctant to Fall After Filling Week
market news
Gold's short-term downward flag-shaping, can the CPI data emerge from the volatility tonight
Wonderful introduction:
Optimism is the line of egrets that are straight up to the blue sky, optimism is the thousands of white sails beside the sunken boat, optimism is the lush grass that blows with the wind on the head of the parrot island, optimism is the falling red spots that turn into spring mud to protect the flowers.
Hello everyone, today XM Foreign Exchange will bring you "[XM Foreign Exchange Platform]: Gold has a short-term downward trend, can the CPI data emerge from the fluctuation tonight?" Hope it will be helpful to you! The original content is as follows:
Zheng's silver point: Gold's short-term decline in flag shape, can the CPI data emerge from the fluctuation tonight?
Review yesterday's market trend and technical points:
First, in terms of gold: Yesterday's first decline, losing the trend support line, and using the rebound to confirm the trend line's reverse pressure point 3317-18, which is also the 618 segmentation resistance Go to try the European session and see that the decline continues, but the market has gone through a V pull up. After breaking through the Asian session high, it is judged that there will be a second rise in the evening, and the target 3348 is just in place; the research report also suggests that if you cannot pass the resistance of 3348, you will still fluctuate back;
Second, in terms of silver: After the 15-minute small cycle convergence triangle consolidation and breaking through the upward breakthrough, 36.6 continues to follow the bullishness, but unfortunately it only gives 36.8, and the US market falls into a fluctuation. After losing these days' trend support lines, it is recommended to adjust positions in advance, and there is a risk of short-term consolidation or adjustment;
Third, in terms of crude oil: for two consecutive days, waiting for the daily trend resistance line 66-66.2 to touch and bear pressure, supporting 64-63.8. This is also the range given in the past two days, which basically meets the range fluctuations within the range;
Interpretation of today's market analysis:
First, gold daily level: Yesterday The daily closing of the cross K, and it is still impossible to break through the 5 moving average and cannot effectively fall below the middle track, so short-term bulls and bears are still in a sideways struggle; today's short-term moving average is dead crossing for 10 days on the 5th day, and then it will rise first in the day and run above the 5th day, which will form a certain index divergence, which is easy to rise and fall; therefore, after the clear range of 3350-3293 in these days, it will naturally choose to oscillate and bearishly fall;Tonight, the market expects to start to rise. Once it meets, gold will suppress it. Only by squatting again can we usher in the opportunity to bottom out at this week's low level; the video originally indicated that the ideal position was 3228, but judging from the resistance to decline in the past two days, it is expected to be carried out in advance, or after puncture of the early low of 3293 weeks, this week's low may be brewed, such as 3280, 3270, etc. Let's see if the line closes today and then decide step by step;
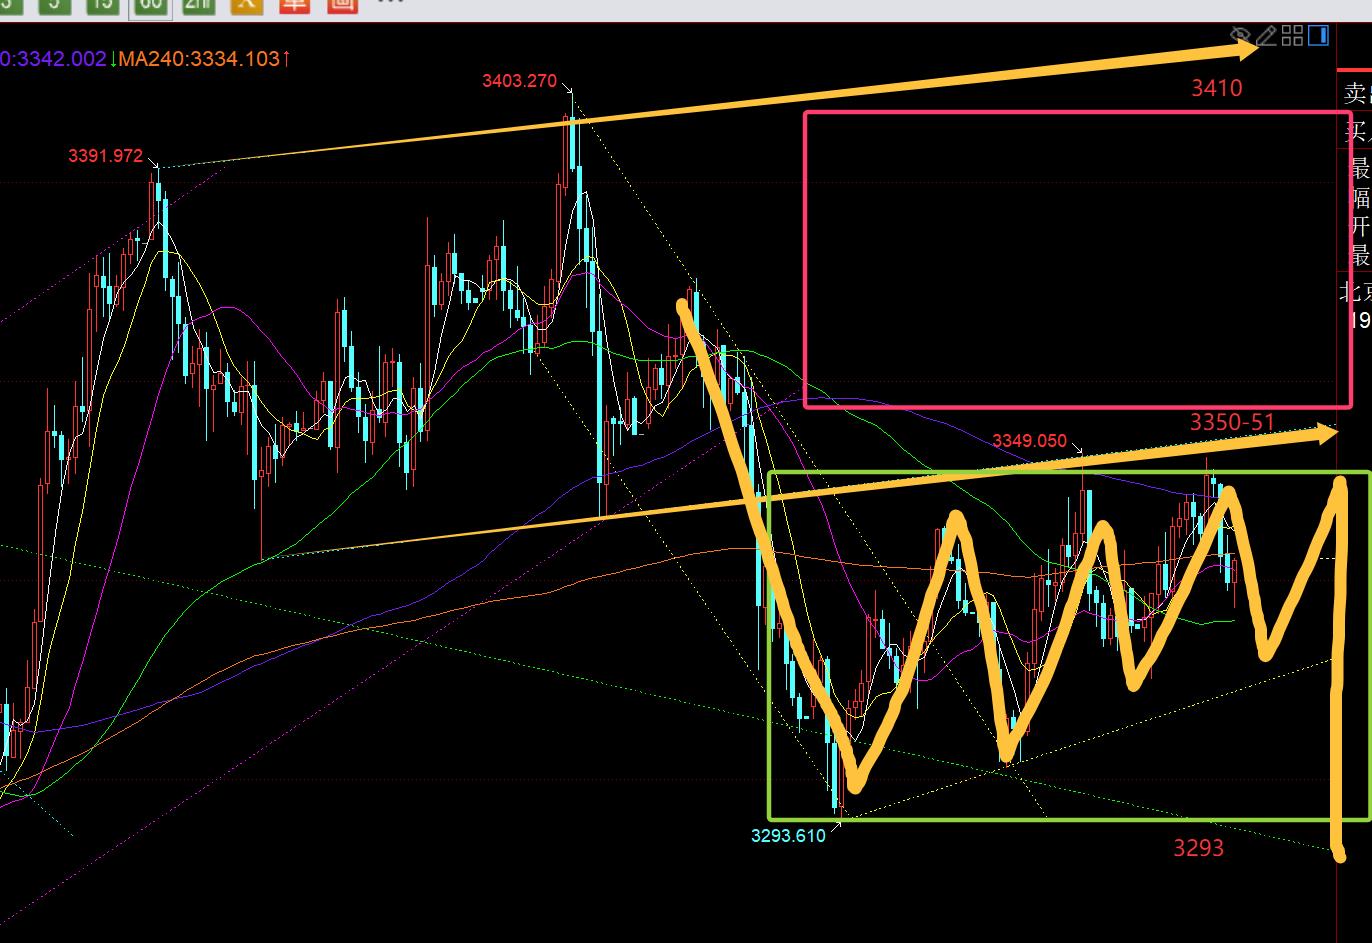
Second, the golden hourly line level: it fell sharply to 3315 early in the morning and stabilized, and fluctuated all the way up. After the European session hit 3348 under pressure, it surged and fell back to the current 3330; from the above figure, it is actually still in the downward trend, but the flag has expanded. So as long as the upper track of the flag 3350 breaks through before standing up, there is a high probability that there will still be a downward trend, losing to 3293. After lowering, it will only appear this week's best bottom-up low. As for where it is located, it is still a few given in the weekly video. Tonight's resistance is still concentrated in the high area of 3350-3344, supporting 3315-13, 3301, 3293, and then down there are 3280, 3271, 3263, etc.; whether it can be suppressed quickly depends on tonight's inflation data to stimulate and guide to see whether it goes higher; of course, if inflation is still lower, then it will support the gold price to rise, then it will look at whether the upper 3350-51 line can break through the standing point, and if it stands firm, it will return to the previous channel range of 3350-3410;
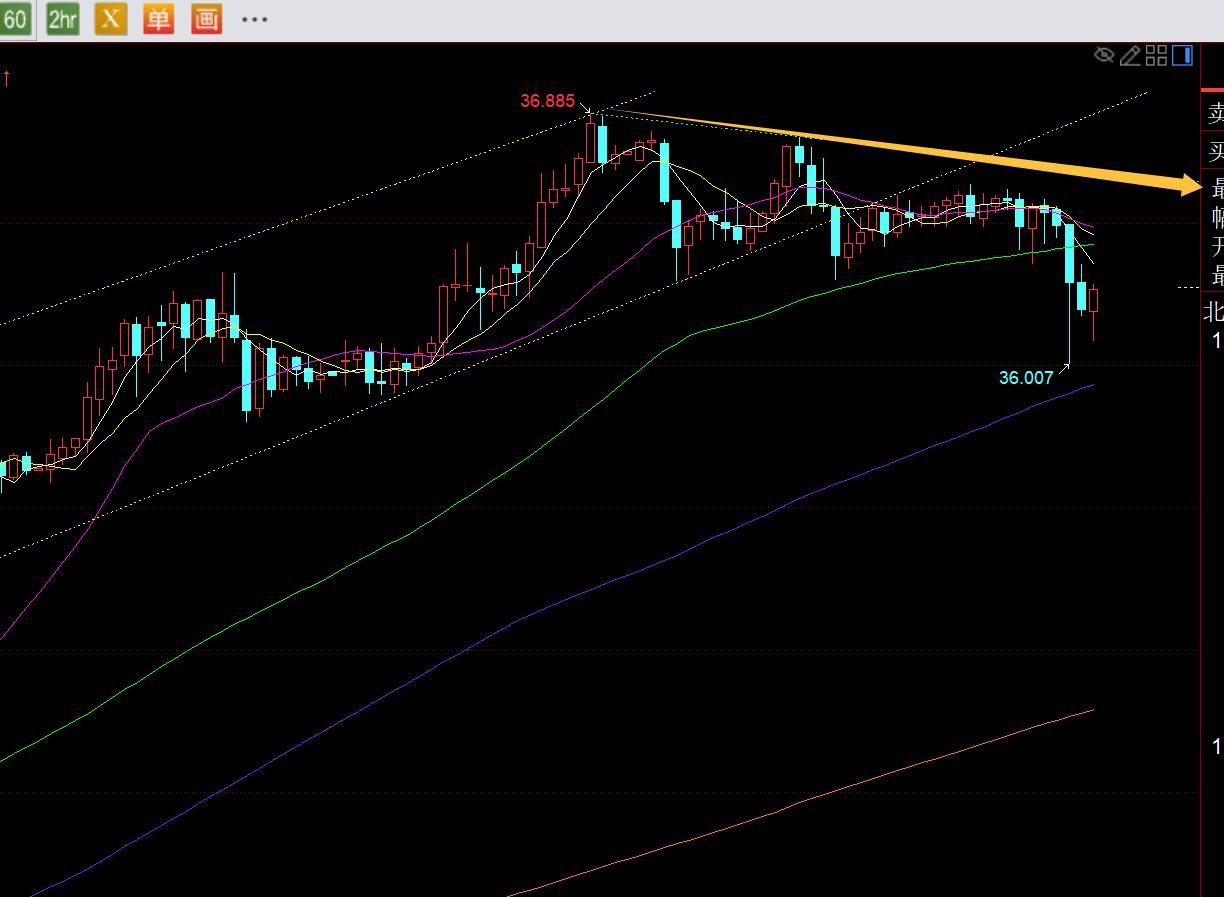
Silver: Due to the crazy continuous rebound in the past few days, short-term macd cannot be well repaired so far, so there will be a plunge correction at any time. Today, the European session has already begun from 36.6 to 36. As long as the trend resistance line in the chart cannot break through before the station is up, this correction may continue, and there is no rush to bullish for the time being; the daily 5 moving average supports 36.2. If the closing falls today, it will gradually be corrected to the 10 moving average. At that time, it will be a good time to bullish at low levels when it hits there for the first time;
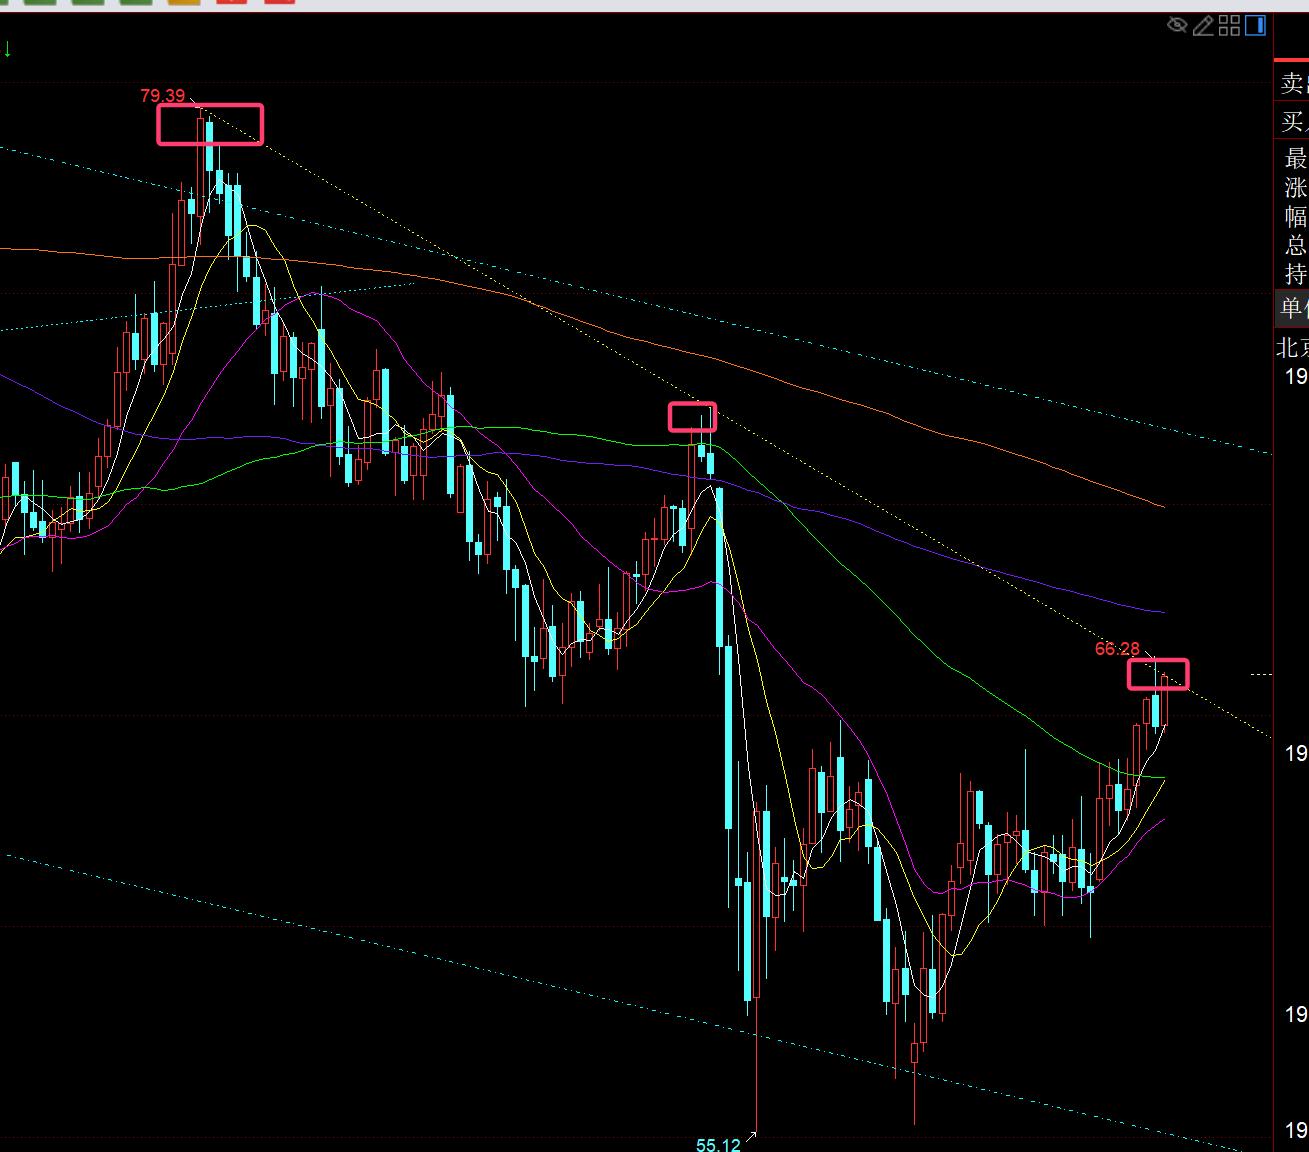
In terms of crude oil: The repetitiveness of crude oil is also relatively strong. It has just continued to weaken and fall overnight. Today, it has all recovered its decline and returned to the 66 line again. So tonight, we will observe the gains and losses of the trend resistance line in the above chart to see if it can be suppressed again, or choose to break up; therefore, we must wait for the hourly line pattern to confirm, for example, the top inverted hammer head at the top was a good suppression signal; if the full and big positive K stood firm at 66-66.2, then it is not suitable to be bearish;
The above are several points of the author's technical analysis, as reference, It is also the summary of technical experience accumulated over 12 hours of daily watch and review of the market for more than 12 hours a day. Technical points are disclosed every day, and those who want to learn can xm-forex.compare and refer to it based on the actual trend; those who recognize ideas can refer to it, lead the defense well, and risk control first; those who do not agree should just be over; thank everyone for their support and attention;
[The article views are for reference only, investment is risky, and you need to be cautious, rational, strictly set losses, control positions, risk control first, and you will be responsible for your own profits and losses]
Contributor: Zheng's Dianyin
After reading and research on the market for more than 12 hours a day, persisting for ten years, detailed technical interpretation is disclosed on the entire network, and serve the whole network with sincerity, sincerity, perseverance and wholeheartedness! xm-forex.comments written on major financial websites! Proficient in the K-line rules, channel rules, time rules, moving average rules, segmentation rules, and top and bottom rules; student cooperation registration hotline - WeChat: zdf289984986
The above content is all about "[XM Foreign Exchange Platform]: Gold has a short-term downward trend, can the CPI data escape the oscillation tonight?" It is carefully xm-forex.compiled and edited by the XM Foreign Exchange editor. I hope it will be helpful to your trading! Thanks for the support!
In fact, responsibility is not helpless, it is not boring, it is as gorgeous as a rainbow. It is this colorful responsibility that has created a better life for us today. I will try my best to organize the article.
Disclaimers: XM Group only provides execution services and access permissions for online trading platforms, and allows individuals to view and/or use the website or the content provided on the website, but has no intention of making any changes or extensions, nor will it change or extend its services and access permissions. All access and usage permissions will be subject to the following terms and conditions: (i) Terms and conditions; (ii) Risk warning; And (iii) a complete disclaimer. Please note that all information provided on the website is for general informational purposes only. In addition, the content of all XM online trading platforms does not constitute, and cannot be used for any unauthorized financial market trading invitations and/or invitations. Financial market transactions pose significant risks to your investment capital.
All materials published on online trading platforms are only intended for educational/informational purposes and do not include or should be considered for financial, investment tax, or trading related consulting and advice, or transaction price records, or any financial product or non invitation related trading offers or invitations.
All content provided by XM and third-party suppliers on this website, including opinions, news, research, analysis, prices, other information, and third-party website links, remains unchanged and is provided as general market commentary rather than investment advice. All materials published on online trading platforms are only for educational/informational purposes and do not include or should be considered as applicable to financial, investment tax, or trading related advice and recommendations, or transaction price records, or any financial product or non invitation related financial offers or invitations. Please ensure that you have read and fully understood the information on XM's non independent investment research tips and risk warnings. For more details, please click here