


Trusted by over 15 Million Traders
The Most Awarded Broker
for a Reason
Easy Access to 1,400+ Global Assets
EURUSD
Euro vs U.S. Dollar
US500
S&P 500 (US500)
GOLD
Gold
COFFEE
US Coffee
Apple
Apple (AAPL.OQ)
-

Finance Magnates 颁发
-

Finance Magnates 颁发
-

Capital Finance International Magazine (CFI.co) 2024年颁赠
-

COLWMA 2024年颁赠
-

荣获World Finance Forex Awards 2023最佳外汇客户服务奖
-

荣获World Finance Forex Awards 2023欧洲最佳外汇经纪商奖
-

荣获World Finance Forex Awards 2023澳大拉西亚最佳外汇经纪商奖
-

荣获World Finance Forex Awards 2023拉丁美洲最佳外汇经纪商奖
-

荣获World Finance Forex Awards 2023中东最佳外汇经纪商奖
-

CFI.co于2023年颁赠
-

荣获2023年City of London Wealth Management Awards
-

荣获2022年埃及金融博览会颁赠
-

荣获2022年City of London Wealth Management Awards
-

CFI.co于2022年颁赠
-

荣获Global Forex Awards 2022 — 零售外汇 颁赠
-
2021年迪拜外汇博览会获颁赠
-

Ultimate Fintech 2021年颁赠
-

荣获2021年City of London Wealth Management Awards
-

FX168于2020年12月颁赠
-

荣获Global Business Awards 2020
-

荣获2020年City of London Wealth Management Awards
-

Capital Finance International Magazine (CFI.co)颁赠
-

Capital Finance International Magazine (CFI.co)颁赠
-

荣获2019年City of London Wealth Management Awards
-

Shares Magazine 授予 UK Forex Awards 2018
-

Capital Finance International Magazine (CFI.co)颁赠
-

Capital Finance International Magazine (CFI.co)颁赠
-

2017年伦敦财富管理奖
-

2016最佳本土 客户服务
-

中东和北非地区(MENA)增长最快的经纪商
-
2015年最佳外汇科技提供商
-
2014年最佳外汇科技提供商
-

2014年最佳外汇科技提供商
-

荣获 The Trading Show 2024年非洲 Africa Fintech 峰会颁赠
-

荣获2024年中东地区 Brokersview 颁赠
-
荣获2024年中东地区 Brokersview 颁赠
-

荣获2024年阿曼 Smart Vision 峰会颁赠
-

荣获2024年迪拜外汇博览会颁赠
-

荣获2024年迪拜 Forex Traders Summit 颁赠
-

2024年埃及 Smart Vision 峰会颁赠
-

投查查于2024年颁赠
-

Capital Finance International Magazine (CFI.co) 2024年颁赠
-

CFI.co于2023年颁赠
-

CFI.co于2023年颁赠
-

交易社区平台FOLLOWME于2022年颁赠
-
2022年迪拜Forex Expo获颁赠
-
2022年迪拜Forex Expo获颁赠
-

荣获Global Forex Awards 2022 — 零售外汇 颁赠
-

CFI.co于2022年颁赠
-

CFI.co于2022年颁赠
-

World Finance Forex Awards 2022 颁发
-

World Finance Forex Awards 2022 颁发
-

World Finance Forex Awards 2022 颁发
-

World Finance Forex Awards 2022 颁发
-
交易社区平台FOLLOWME于2021年颁赠
-

2021年埃及Smart Vision Investment Expo博览会获颁赠
-

CFI.co于2021年颁赠
-

CFI.co于2021年颁赠
-

荣获Global Forex Awards 2021 — 零售外汇 颁赠
-

荣获Global Forex Awards 2021 — 零售外汇 颁赠
-

World Finance 2021颁发
-

World Finance 2021颁发
-
FOLLOWME于2021年颁赠
-

Global Forex Awards 2021 — B2B 颁赠
-

Global Forex Awards颁赠
-

Global Forex Awards颁赠
-

CFI.co于2020年颁赠
-

CFI.co于2020年颁赠
-

荣获Global Business Awards 2020
-

World Finance Magazine 颁赠
World Finance Forex Awards 2020 -

World Finance Magazine 颁赠
World Finance Forex Awards 2020 -
FOLLOWME交易社区授予
-

Global Forex Awards颁赠
-

Global Forex Awards颁赠
-

FinTech Age Awards颁发
-

World Finance Magazine 颁赠
World Finance Forex Awards 2019 -

World Finance Magazine 颁赠
World Finance Forex Awards 2019 -

荣获 World Finance Forex Awards 2018 颁赠
-

荣获2018年埃及金融博览会颁赠
-

荣获 Shares Magazine 的 UK Forex Awards 2017 颁赠
-

荣获 World Finance Forex Awards 2017
-

2016年最佳黄金经纪商
-

2016年最佳外汇经纪商
-

2015年最佳本地客户服务
-

Global Brands Magazine 颁赠
-

Online Money Awards 2022 颁发
-

荣获2022年埃及金融博览会颁赠
-

2015最佳外汇交易平台
-

2015最佳金融交易平台
-

2013最佳创新外汇平台奖
-

2020年 Cyprus HR Awards 颁赠
-

金融行业的佼佼者
-

认证最优金牌级别
-

2014年首届亚军
-
Finance Magnates 颁发
-
Finance Magnates 颁发
-
Capital Finance International Magazine (CFI.co) 2024年颁赠
-
COLWMA 2024年颁赠
-
荣获World Finance Forex Awards 2023最佳外汇客户服务奖
-
荣获World Finance Forex Awards 2023欧洲最佳外汇经纪商奖
-
荣获World Finance Forex Awards 2023澳大拉西亚最佳外汇经纪商奖
-
荣获World Finance Forex Awards 2023拉丁美洲最佳外汇经纪商奖
-
荣获World Finance Forex Awards 2023中东最佳外汇经纪商奖
-
CFI.co于2023年颁赠
-
荣获2023年City of London Wealth Management Awards
-
荣获2022年埃及金融博览会颁赠
-
荣获2022年City of London Wealth Management Awards
-
CFI.co于2022年颁赠
-
荣获Global Forex Awards 2022 — 零售外汇 颁赠
-
2021年迪拜外汇博览会获颁赠
-
Ultimate Fintech 2021年颁赠
-
荣获2021年City of London Wealth Management Awards
-
FX168于2020年12月颁赠
-
荣获Global Business Awards 2020
-
荣获2020年City of London Wealth Management Awards
-
Capital Finance International Magazine (CFI.co)颁赠
-
Capital Finance International Magazine (CFI.co)颁赠
-
荣获2019年City of London Wealth Management Awards
-
Shares Magazine 授予 UK Forex Awards 2018
-
Capital Finance International Magazine (CFI.co)颁赠
-
Capital Finance International Magazine (CFI.co)颁赠
-
2017年伦敦财富管理奖
-
2016最佳本土 客户服务
-
中东和北非地区(MENA)增长最快的经纪商
-
2015年最佳外汇科技提供商
-
2014年最佳外汇科技提供商
-
2014年最佳外汇科技提供商
-
荣获 The Trading Show 2024年非洲 Africa Fintech 峰会颁赠
-
荣获2024年中东地区 Brokersview 颁赠
-
荣获2024年中东地区 Brokersview 颁赠
-
荣获2024年阿曼 Smart Vision 峰会颁赠
-
荣获2024年迪拜外汇博览会颁赠
-
荣获2024年迪拜 Forex Traders Summit 颁赠
-
2024年埃及 Smart Vision 峰会颁赠
-
投查查于2024年颁赠
-
Capital Finance International Magazine (CFI.co) 2024年颁赠
-
CFI.co于2023年颁赠
-
CFI.co于2023年颁赠
-
交易社区平台FOLLOWME于2022年颁赠
-
2022年迪拜Forex Expo获颁赠
-
2022年迪拜Forex Expo获颁赠
-
荣获Global Forex Awards 2022 — 零售外汇 颁赠
-
CFI.co于2022年颁赠
-
CFI.co于2022年颁赠
-
World Finance Forex Awards 2022 颁发
-
World Finance Forex Awards 2022 颁发
-
World Finance Forex Awards 2022 颁发
-
World Finance Forex Awards 2022 颁发
-
交易社区平台FOLLOWME于2021年颁赠
-
2021年埃及Smart Vision Investment Expo博览会获颁赠
-
CFI.co于2021年颁赠
-
CFI.co于2021年颁赠
-
荣获Global Forex Awards 2021 — 零售外汇 颁赠
-
荣获Global Forex Awards 2021 — 零售外汇 颁赠
-
World Finance 2021颁发
-
World Finance 2021颁发
-
FOLLOWME于2021年颁赠
-
Global Forex Awards 2021 — B2B 颁赠
-
Global Forex Awards颁赠
-
Global Forex Awards颁赠
-
CFI.co于2020年颁赠
-
CFI.co于2020年颁赠
-
荣获Global Business Awards 2020
-
World Finance Magazine 颁赠
World Finance Forex Awards 2020 -
World Finance Magazine 颁赠
World Finance Forex Awards 2020 -
FOLLOWME交易社区授予
-
Global Forex Awards颁赠
-
Global Forex Awards颁赠
-
FinTech Age Awards颁发
-
World Finance Magazine 颁赠
World Finance Forex Awards 2019 -
World Finance Magazine 颁赠
World Finance Forex Awards 2019 -
荣获 World Finance Forex Awards 2018 颁赠
-
荣获2018年埃及金融博览会颁赠
-
荣获 Shares Magazine 的 UK Forex Awards 2017 颁赠
-
荣获 World Finance Forex Awards 2017
-
2016年最佳黄金经纪商
-
2016年最佳外汇经纪商
-
2015年最佳本地客户服务
-
Global Brands Magazine 颁赠
-
Online Money Awards 2022 颁发
-
荣获2022年埃及金融博览会颁赠
-
2015最佳外汇交易平台
-
2015最佳金融交易平台
-
2013最佳创新外汇平台奖
-
2020年 Cyprus HR Awards 颁赠
-
金融行业的佼佼者
-
认证最优金牌级别
-
2014年首届亚军

Awarded BestBrokerYear After Year
CATEGORIES
News
- 【XM Group】--AUD/CHF Forecast: Bounces from Key Support
- 【XM Market Analysis】--USD/CAD Forecast: Pushes Higher Amid Dollar Strength
- 【XM Market Analysis】--GBP/USD Forex Signal: Inverse H&S Points to More Gains
- 【XM Group】--BTC/USD Forecast: Can Bitcoin Break Higher?
- 【XM Market Review】--USD/CAD Forecast: Can the Loonie Hang On?
market news
Supported by the Russian-Ukrainian conflict, constrained by Sino-US negotiations, CPI data becomes the key
Wonderful introduction:
Since ancient times, there have been joys and sorrows, and since ancient times, there have been sorrowful moon and songs. But we never understood it, and we thought everything was just a distant memory. Because there is no real experience, there is no deep feeling in the heart.
Hello everyone, today XM Foreign Exchange will bring you "[XM Foreign Exchange Platform]: Supported by the Russian-Ukrainian conflict, constrained by Sino-US negotiations, and CPI data becomes the key." Hope it will be helpful to you! The original content is as follows:
Macro
In the context of global economic and geopolitical turmoil, gold prices rose and fell on Tuesday. After hitting $3,349/ounce during the session, they finally closed at $3,322.36/ounce, a drop of about 0.09%.
The Russian-Ukrainian conflict continues to escalate, and Russian military strikes against Ukraine and Ukrainian drone attacks have frequently occurred, which has caused investors to worry about global security. A large amount of funds have poured into the gold market, becoming an important support for the rise in gold prices. At the same time, the World Bank lowered its global economic growth forecast in 2025 to 2.3%, and trade barriers intensified, further highlighting the gold's value preservation attributes.
However, the smooth progress of Sino-US trade negotiations has brought optimistic expectations, and the market believes that trade tensions may ease and the global economy will be boosted, weakening demand for gold safe-haven. In addition, the upcoming US CPI data for May has attracted attention, and factors such as inflation expectations, the probability of the Federal Reserve's interest rate cut, and the strengthening of the US dollar index have also limited the upward space for gold prices. At present, the gold market is intertwined with long and short factors, and its future trends still depend on geopolitics, economic data and progress in trade negotiations.
Dollar Index
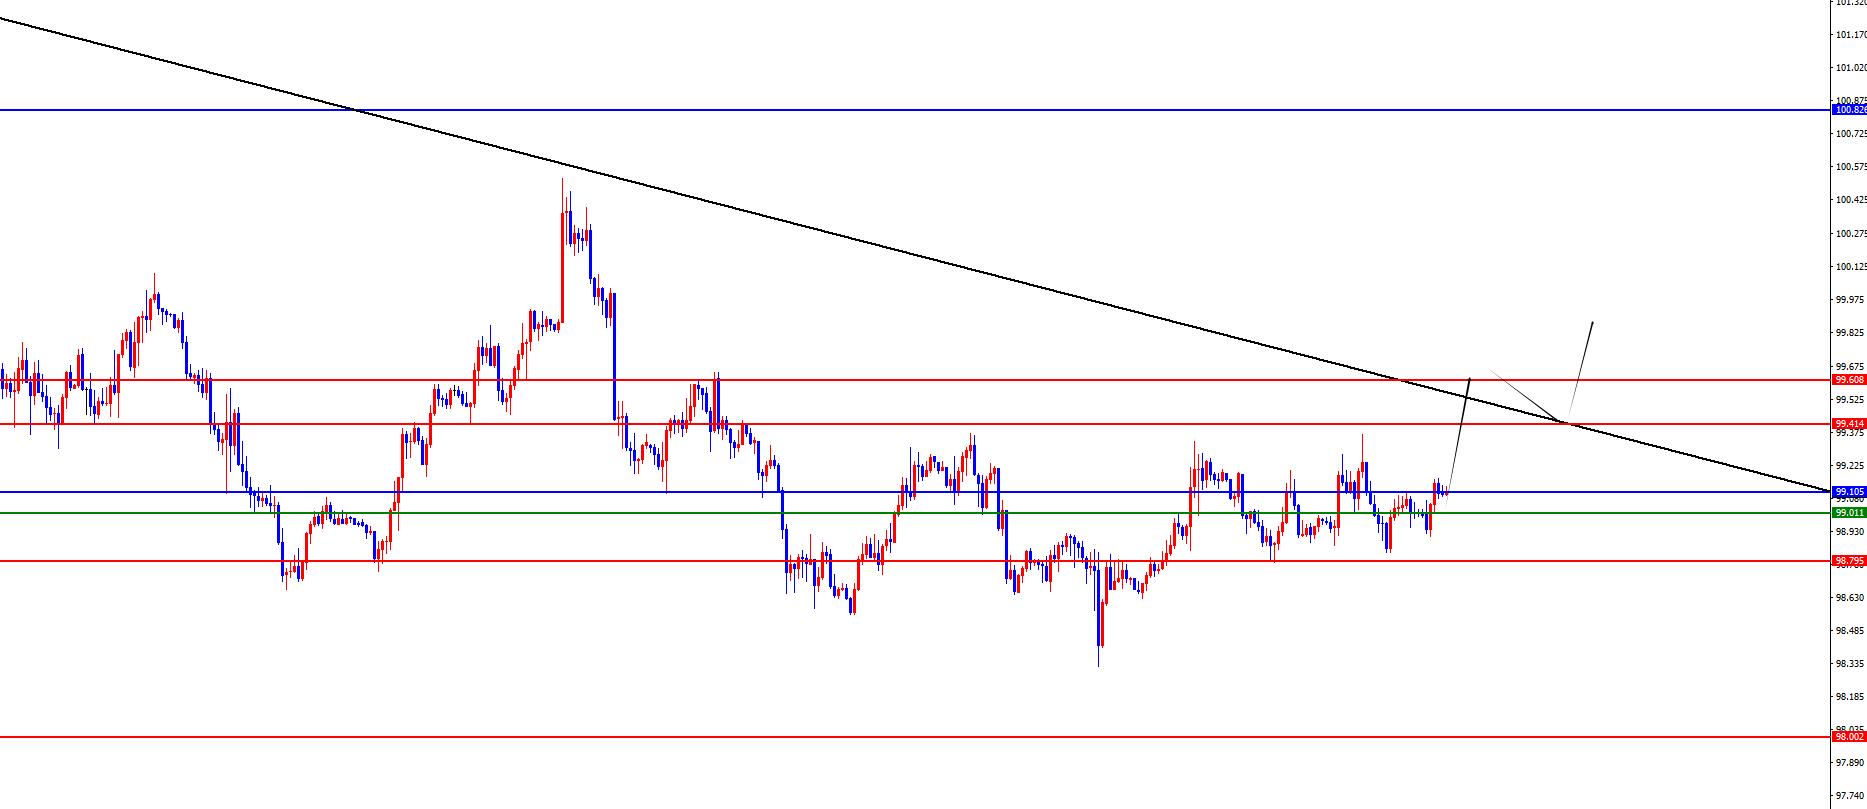
In terms of the performance of the US dollar index, the US dollar index showed a volatile trend on Tuesday. The price of the US dollar index rose to 99.367 on the day, and fell to 98.835 at the lowest, and finally closed at 99.009. Looking back on Tuesday's market performance, during the early trading session, the price rose first and pierced the daily resistance position. Although it was under pressure after the European session, it did not break the key support we emphasized. It fluctuated and rose overnight. Finally, the small positive ended on the same day. The price still continued to break through and stabilized the daily resistance. Pay attention to the strength of the CPI data.
From a multi-cycle analysis, the price is suppressed in the 100.80 area of resistance at the weekly level, so from a medium-term perspective, the trend of the US dollar index will be more bearish. At the daily level, the key price resistance position is at 99.10 as time goes by. It is important to pay attention to whether the price can stabilize the daily resistance. At the same time, the price has continued to fluctuate in recent days in four hours. We will focus on the 98.80 regional support for the time being. At this point, the price will continue to be bullish. We will observe the daily resistance to stabilize the performance. Once it stands firm, there will be an accelerated rise in the future, so everyone must pay attention to it.
The US dollar index continued to hold the 98.80-90 range, with a target of 99.40-99.60
Gold
In terms of gold, the overall price of gold showed a decline on Tuesday. The price rose to the highest point of 3349 on the day, and fell to the lowest point of 3301 on the spot, closing at 3322.36 on the spot. Regarding the continuous decline of gold prices during the early trading session on Tuesday, when it hit around 3300, it corrected upward again. The price broke through the four-hour resistance position in the European session. At the same time, the high point of the day was the area where the previous upward trend line broke through and retraceeded twice. This position was also a 50% position that fell from 3403.36 to 3293.60. Finally, the negative line ended on the day. Overall, gold remained short. The rise was only treated as a correction. At present, the focus is on yesterday's high resistance and the 3360 area resistance.
From multi-cycle analysis, first observe the monthly rhythm. The price runs at the rhythm in May as the author said, and the final cross state. For June, the long-term watershed is at 2780. From the weekly level, gold prices are supported by the support level in the 3217-3220 area. So from the perspective of the mid-term, it is still in the mid-term bull market, but we need to pay attention to the subsequent retracement and follow-up gains and losses. Once the price breaks the weekly support, it will be further under pressure. Judging from the daily level, prices have maintained a consolidation in the daily watershed in recent days, so they are currently inclined to be short-term fluctuations. Today, CPI data will be ushered in, paying attention to the stimulation of data on gold. The price on the four-hour top is also consolidated up and down in the four-hour watershed. In the future, we will pay attention to the adjustment and continue to bear pressure after the adjustment. In the position, we will pay attention to yesterday's high and trend line continue to fall back to the 3360-3361 position in the retracement area of 618.

Gold was under pressure before it was high yesterday and unexpectedly broke into the 3360-3361 range. (Conservatives pay attention to the 3360 area and re-layout)
Europe and the United States
Europe and the United States
Europe and the United States
Europe and the United States
Europe and the United States
Europe and the United States
Europe and the United States
Europe and the United States
Europe and the United States
Europe and the United States
Europe and the United States
Europe and the United States
Europe and the United States
Europe and the United States
Europe and the United States
Europe and the United States
Europe and the United States
Europe and the United States
Europe and the United States
Europe and the United States
Europe and the United States
Europe and the United States
Europe and the United States
Europe and the United States
Europe and the United States
Europe and the United States
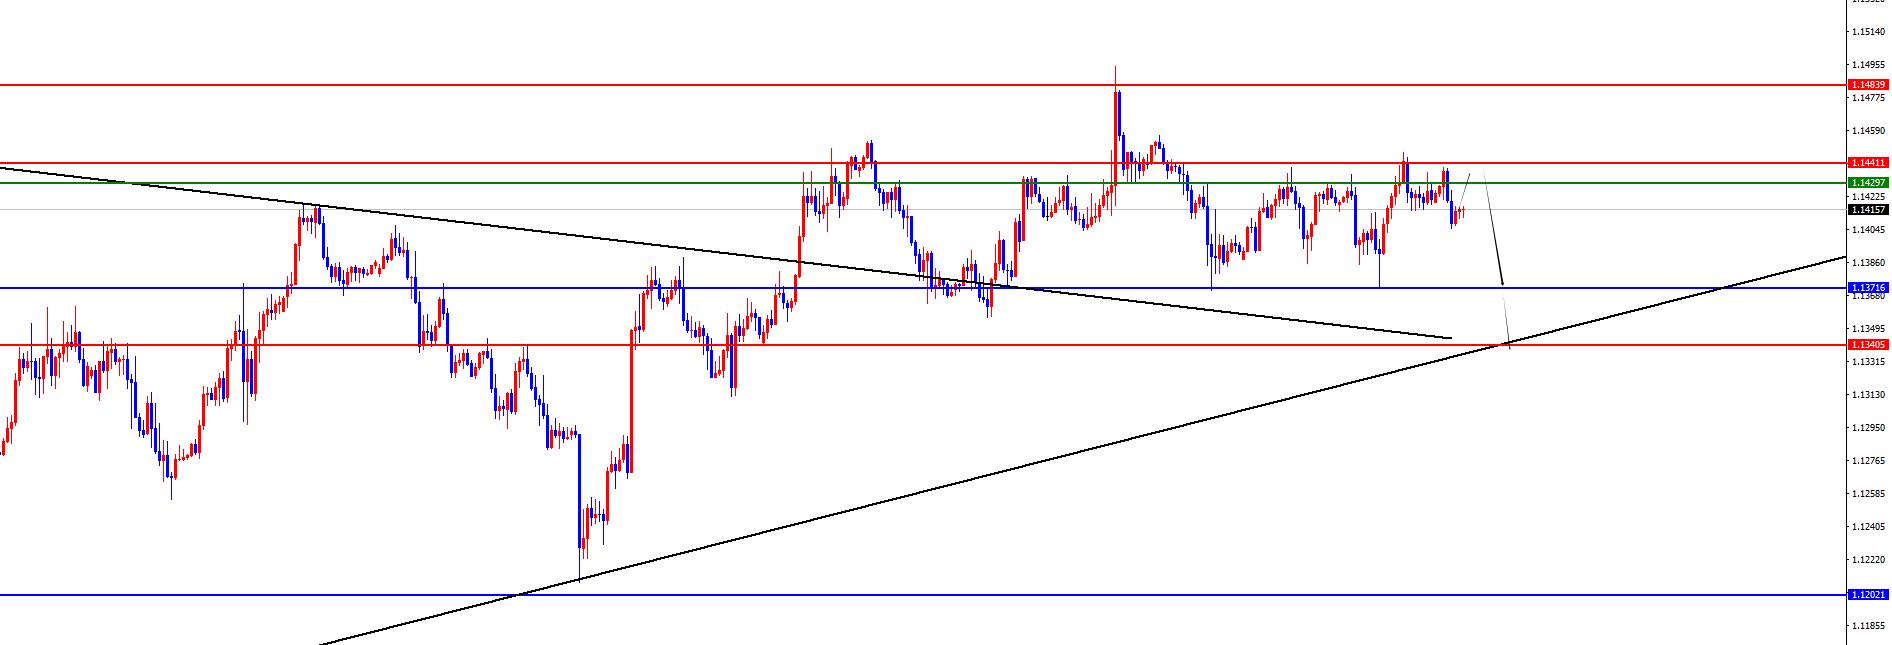
Europe and the United States were generally fluctuating and rising on Tuesday.state. The price fell to 1.1372 at the lowest point on the day, and rose to 1.1447 at the highest point and closed at 1.1421 at the same time. Looking back at the performance of European and American markets on Tuesday, the price continued to decline in the short term during the early trading session, and the price also tested to the daily support position as scheduled, but then the price rose rapidly and broke through yesterday's high point, and the daily positive line ended. At present, we need to continue to pay attention to the gains and losses of the daily watershed position in the future. Once it breaks down, the band pressure performance will continue in the future.
From a multi-cycle analysis, from the monthly level, Europe and the United States are supported by 1.0850, so long-term bulls are treated. From the weekly level, the price is supported by the 1.1200 area, and from the perspective of the mid-line, the price decline is temporarily treated as a correction in the mid-line rise. From the daily level, as time goes by, we need to focus on the gains and losses of the 1.1385 area. This position determines the key to the band trend. At the same time, the lower trend line support 1.1340 area is also a support that needs to be paid attention to, so we will focus on the trend line support and the daily support range to fall below the performance. According to the four-hour level, we need to pay attention to the resistance in the range of 1.1430-40 and wait for further pressure performance in the market.
Europe and the United States have a short range of 1.1430-40, defense is 1.0500, target 1.1385-1.1340 (the breaking band is under pressure opened)
[Finance data and events that are focused today] Wednesday, June 11, 2025
①20:30 US May unseasoned CPI annual rate
②20:30 US May seasonally adjusted CPI monthly rate
③20:30 US May seasonally adjusted core CPI monthly rate
④20:30 US May seasonally adjusted core CPI annual rate
⑤22:30 EIA crude oil inventories in the week from the United States to June 6
⑥22:30 EIA Cushing crude oil inventories in the week from the United States to June 6
⑦22:30 EIA strategic oil reserve inventories in the week from the United States to June 6
⑧The next day, 01:00 US to June 11 10-year Treasury bond auction-winning interest rate
⑨The next day, 01:00 US to June 11 10-year Treasury bond auction-winning multiple
Note: The above is only personal opinion and strategy, for reference and xm-forex.communication only, and does not give customers any investment advice. It has nothing to do with customers' investment, and is not used as a basis for placing an order.
The above content is all about "[XM Foreign Exchange Platform]: Supported by the Russian-Ukrainian conflict, constrained by Sino-US negotiations, and CPI data becomes the key". It was carefully xm-forex.compiled and edited by the XM Foreign Exchange editor. I hope it will be helpful to your transactions! Thanks for the support!
Life in the present, don’t waste your current life in missing the past or looking forward to the future.
Disclaimers: XM Group only provides execution services and access permissions for online trading platforms, and allows individuals to view and/or use the website or the content provided on the website, but has no intention of making any changes or extensions, nor will it change or extend its services and access permissions. All access and usage permissions will be subject to the following terms and conditions: (i) Terms and conditions; (ii) Risk warning; And (iii) a complete disclaimer. Please note that all information provided on the website is for general informational purposes only. In addition, the content of all XM online trading platforms does not constitute, and cannot be used for any unauthorized financial market trading invitations and/or invitations. Financial market transactions pose significant risks to your investment capital.
All materials published on online trading platforms are only intended for educational/informational purposes and do not include or should be considered for financial, investment tax, or trading related consulting and advice, or transaction price records, or any financial product or non invitation related trading offers or invitations.
All content provided by XM and third-party suppliers on this website, including opinions, news, research, analysis, prices, other information, and third-party website links, remains unchanged and is provided as general market commentary rather than investment advice. All materials published on online trading platforms are only for educational/informational purposes and do not include or should be considered as applicable to financial, investment tax, or trading related advice and recommendations, or transaction price records, or any financial product or non invitation related financial offers or invitations. Please ensure that you have read and fully understood the information on XM's non independent investment research tips and risk warnings. For more details, please click here