


Trusted by over 15 Million Traders
The Most Awarded Broker
for a Reason
Easy Access to 1,400+ Global Assets
EURUSD
Euro vs U.S. Dollar
US500
S&P 500 (US500)
GOLD
Gold
COFFEE
US Coffee
Apple
Apple (AAPL.OQ)
-

Finance Magnates 颁发
-

Finance Magnates 颁发
-

Capital Finance International Magazine (CFI.co) 2024年颁赠
-

COLWMA 2024年颁赠
-

荣获World Finance Forex Awards 2023最佳外汇客户服务奖
-

荣获World Finance Forex Awards 2023欧洲最佳外汇经纪商奖
-

荣获World Finance Forex Awards 2023澳大拉西亚最佳外汇经纪商奖
-

荣获World Finance Forex Awards 2023拉丁美洲最佳外汇经纪商奖
-

荣获World Finance Forex Awards 2023中东最佳外汇经纪商奖
-

CFI.co于2023年颁赠
-

荣获2023年City of London Wealth Management Awards
-

荣获2022年埃及金融博览会颁赠
-

荣获2022年City of London Wealth Management Awards
-

CFI.co于2022年颁赠
-

荣获Global Forex Awards 2022 — 零售外汇 颁赠
-
2021年迪拜外汇博览会获颁赠
-

Ultimate Fintech 2021年颁赠
-

荣获2021年City of London Wealth Management Awards
-

FX168于2020年12月颁赠
-

荣获Global Business Awards 2020
-

荣获2020年City of London Wealth Management Awards
-

Capital Finance International Magazine (CFI.co)颁赠
-

Capital Finance International Magazine (CFI.co)颁赠
-

荣获2019年City of London Wealth Management Awards
-

Shares Magazine 授予 UK Forex Awards 2018
-

Capital Finance International Magazine (CFI.co)颁赠
-

Capital Finance International Magazine (CFI.co)颁赠
-

2017年伦敦财富管理奖
-

2016最佳本土 客户服务
-

中东和北非地区(MENA)增长最快的经纪商
-
2015年最佳外汇科技提供商
-
2014年最佳外汇科技提供商
-

2014年最佳外汇科技提供商
-

荣获 The Trading Show 2024年非洲 Africa Fintech 峰会颁赠
-

荣获2024年中东地区 Brokersview 颁赠
-
荣获2024年中东地区 Brokersview 颁赠
-

荣获2024年阿曼 Smart Vision 峰会颁赠
-

荣获2024年迪拜外汇博览会颁赠
-

荣获2024年迪拜 Forex Traders Summit 颁赠
-

2024年埃及 Smart Vision 峰会颁赠
-

投查查于2024年颁赠
-

Capital Finance International Magazine (CFI.co) 2024年颁赠
-

CFI.co于2023年颁赠
-

CFI.co于2023年颁赠
-

交易社区平台FOLLOWME于2022年颁赠
-
2022年迪拜Forex Expo获颁赠
-
2022年迪拜Forex Expo获颁赠
-

荣获Global Forex Awards 2022 — 零售外汇 颁赠
-

CFI.co于2022年颁赠
-

CFI.co于2022年颁赠
-

World Finance Forex Awards 2022 颁发
-

World Finance Forex Awards 2022 颁发
-

World Finance Forex Awards 2022 颁发
-

World Finance Forex Awards 2022 颁发
-
交易社区平台FOLLOWME于2021年颁赠
-

2021年埃及Smart Vision Investment Expo博览会获颁赠
-

CFI.co于2021年颁赠
-

CFI.co于2021年颁赠
-

荣获Global Forex Awards 2021 — 零售外汇 颁赠
-

荣获Global Forex Awards 2021 — 零售外汇 颁赠
-

World Finance 2021颁发
-

World Finance 2021颁发
-
FOLLOWME于2021年颁赠
-

Global Forex Awards 2021 — B2B 颁赠
-

Global Forex Awards颁赠
-

Global Forex Awards颁赠
-

CFI.co于2020年颁赠
-

CFI.co于2020年颁赠
-

荣获Global Business Awards 2020
-

World Finance Magazine 颁赠
World Finance Forex Awards 2020 -

World Finance Magazine 颁赠
World Finance Forex Awards 2020 -
FOLLOWME交易社区授予
-

Global Forex Awards颁赠
-

Global Forex Awards颁赠
-

FinTech Age Awards颁发
-

World Finance Magazine 颁赠
World Finance Forex Awards 2019 -

World Finance Magazine 颁赠
World Finance Forex Awards 2019 -

荣获 World Finance Forex Awards 2018 颁赠
-

荣获2018年埃及金融博览会颁赠
-

荣获 Shares Magazine 的 UK Forex Awards 2017 颁赠
-

荣获 World Finance Forex Awards 2017
-

2016年最佳黄金经纪商
-

2016年最佳外汇经纪商
-

2015年最佳本地客户服务
-

Global Brands Magazine 颁赠
-

Online Money Awards 2022 颁发
-

荣获2022年埃及金融博览会颁赠
-

2015最佳外汇交易平台
-

2015最佳金融交易平台
-

2013最佳创新外汇平台奖
-

2020年 Cyprus HR Awards 颁赠
-

金融行业的佼佼者
-

认证最优金牌级别
-

2014年首届亚军
-
Finance Magnates 颁发
-
Finance Magnates 颁发
-
Capital Finance International Magazine (CFI.co) 2024年颁赠
-
COLWMA 2024年颁赠
-
荣获World Finance Forex Awards 2023最佳外汇客户服务奖
-
荣获World Finance Forex Awards 2023欧洲最佳外汇经纪商奖
-
荣获World Finance Forex Awards 2023澳大拉西亚最佳外汇经纪商奖
-
荣获World Finance Forex Awards 2023拉丁美洲最佳外汇经纪商奖
-
荣获World Finance Forex Awards 2023中东最佳外汇经纪商奖
-
CFI.co于2023年颁赠
-
荣获2023年City of London Wealth Management Awards
-
荣获2022年埃及金融博览会颁赠
-
荣获2022年City of London Wealth Management Awards
-
CFI.co于2022年颁赠
-
荣获Global Forex Awards 2022 — 零售外汇 颁赠
-
2021年迪拜外汇博览会获颁赠
-
Ultimate Fintech 2021年颁赠
-
荣获2021年City of London Wealth Management Awards
-
FX168于2020年12月颁赠
-
荣获Global Business Awards 2020
-
荣获2020年City of London Wealth Management Awards
-
Capital Finance International Magazine (CFI.co)颁赠
-
Capital Finance International Magazine (CFI.co)颁赠
-
荣获2019年City of London Wealth Management Awards
-
Shares Magazine 授予 UK Forex Awards 2018
-
Capital Finance International Magazine (CFI.co)颁赠
-
Capital Finance International Magazine (CFI.co)颁赠
-
2017年伦敦财富管理奖
-
2016最佳本土 客户服务
-
中东和北非地区(MENA)增长最快的经纪商
-
2015年最佳外汇科技提供商
-
2014年最佳外汇科技提供商
-
2014年最佳外汇科技提供商
-
荣获 The Trading Show 2024年非洲 Africa Fintech 峰会颁赠
-
荣获2024年中东地区 Brokersview 颁赠
-
荣获2024年中东地区 Brokersview 颁赠
-
荣获2024年阿曼 Smart Vision 峰会颁赠
-
荣获2024年迪拜外汇博览会颁赠
-
荣获2024年迪拜 Forex Traders Summit 颁赠
-
2024年埃及 Smart Vision 峰会颁赠
-
投查查于2024年颁赠
-
Capital Finance International Magazine (CFI.co) 2024年颁赠
-
CFI.co于2023年颁赠
-
CFI.co于2023年颁赠
-
交易社区平台FOLLOWME于2022年颁赠
-
2022年迪拜Forex Expo获颁赠
-
2022年迪拜Forex Expo获颁赠
-
荣获Global Forex Awards 2022 — 零售外汇 颁赠
-
CFI.co于2022年颁赠
-
CFI.co于2022年颁赠
-
World Finance Forex Awards 2022 颁发
-
World Finance Forex Awards 2022 颁发
-
World Finance Forex Awards 2022 颁发
-
World Finance Forex Awards 2022 颁发
-
交易社区平台FOLLOWME于2021年颁赠
-
2021年埃及Smart Vision Investment Expo博览会获颁赠
-
CFI.co于2021年颁赠
-
CFI.co于2021年颁赠
-
荣获Global Forex Awards 2021 — 零售外汇 颁赠
-
荣获Global Forex Awards 2021 — 零售外汇 颁赠
-
World Finance 2021颁发
-
World Finance 2021颁发
-
FOLLOWME于2021年颁赠
-
Global Forex Awards 2021 — B2B 颁赠
-
Global Forex Awards颁赠
-
Global Forex Awards颁赠
-
CFI.co于2020年颁赠
-
CFI.co于2020年颁赠
-
荣获Global Business Awards 2020
-
World Finance Magazine 颁赠
World Finance Forex Awards 2020 -
World Finance Magazine 颁赠
World Finance Forex Awards 2020 -
FOLLOWME交易社区授予
-
Global Forex Awards颁赠
-
Global Forex Awards颁赠
-
FinTech Age Awards颁发
-
World Finance Magazine 颁赠
World Finance Forex Awards 2019 -
World Finance Magazine 颁赠
World Finance Forex Awards 2019 -
荣获 World Finance Forex Awards 2018 颁赠
-
荣获2018年埃及金融博览会颁赠
-
荣获 Shares Magazine 的 UK Forex Awards 2017 颁赠
-
荣获 World Finance Forex Awards 2017
-
2016年最佳黄金经纪商
-
2016年最佳外汇经纪商
-
2015年最佳本地客户服务
-
Global Brands Magazine 颁赠
-
Online Money Awards 2022 颁发
-
荣获2022年埃及金融博览会颁赠
-
2015最佳外汇交易平台
-
2015最佳金融交易平台
-
2013最佳创新外汇平台奖
-
2020年 Cyprus HR Awards 颁赠
-
金融行业的佼佼者
-
认证最优金牌级别
-
2014年首届亚军

Awarded BestBrokerYear After Year
CATEGORIES
News
- 【XM Decision Analysis】--USD/JPY Forecast: US Dollar Pulls Back Against Japanese
- 【XM Market Analysis】--BTC/USD Forex Signal: Bitcoin Forms a Risky Pattern as Ral
- 【XM Market Analysis】--BTC/USD Forex Signal: Stuck in a Range Ahead of a Big Move
- 【XM Forex】--USD/ZAR Forecast: USD Weakens vs. ZAR
- 【XM Market Review】--EUR/USD Forecast: Rallies in Relief Rally
market analysis
【XM Group】--Weekly Forex Forecast – EUR/USD, USD/JPY, Gold, S&P 500 Index, USD/MXN
Risk Warning:
The purpose of information release is to warn investors of risks and does not constitute any investment advice. The relevant data and information are from third parties and are for reference only. Investors are requested to verify before use and assume all risks.
Hello everyone, today XM Forex will bring you "【XM Group】--Weekly Forex Forecast – EUR/USD, USD/JPY, Gold, S&P 500 Index, USD/MXN". I hope it will be helpful to you! The original content is as follows:
Fundamental Analysis & Market Sentiment
I wrote on 20th April that the best trades for the week would be:
The overall result was a loss of 4.30%, which was 1.43% per asset.
Last week saw a much calmer market as we seem to have moved beyond any new tariff bombshells. Negotiations will be ongoing until the 90-day period ends in early July.
The major event of last week, which had a very light news agenda, was President Trump’s attempt at a gentle walk back of his xm-forex.comments blasting Jerome Powell of the Federal Reserve for not cutting rates more aggressively, which had led to a sharp fall in stock markets the previous week. Trump’s xm-forex.comments may have aided the recovery we saw in stock markets and in other risky assets last week.
Last week’s other major data points were:
The Week Ahead: 28th April – 2nd May
The xm-forex.coming week has a busy schedule of important releases, including key US economic data and a policy meeting at the Bank of Japan.
This week’s important data points, in order of likely importance, are:
Monthly Forecast April 2025
For the month of April 2025, I made no monthly forecast, as at the start of that month, the Forex market was dull and there were only mixed long-term trends.
Weekly Forecast 27th April 2025
As there were no unusually large price movements in Forex currency crosses over the past week, I make no weekly forecast.
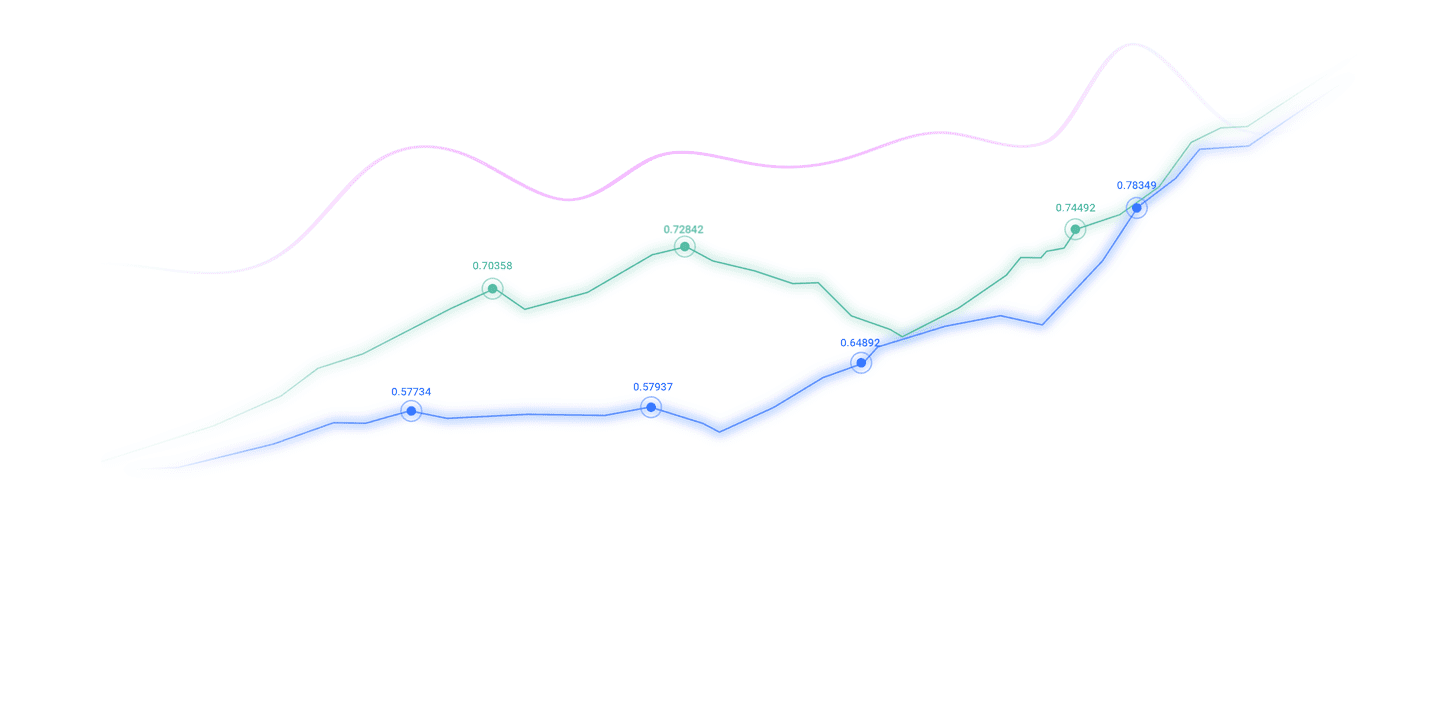
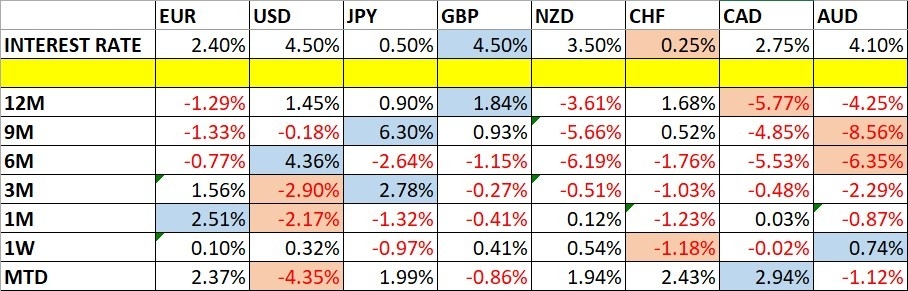
The Australian Dollar was the strongest major currencies last week, while the Swiss Franc was the weakest. Volatility decreased slightly last week, with more than 33% of the most important Forex currency pairs and crosses changing in value by more than 1%. Next week will likely see more volatility as there will be a very full data schedule.
You can trade these forecasts in a real or demo Forex brokerage account.
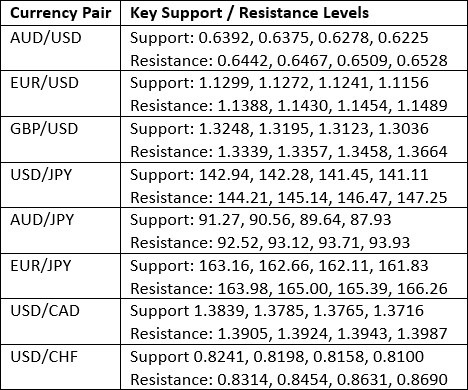
Key Support/Resistance Levels for Popular Pairs
Technical Analysis
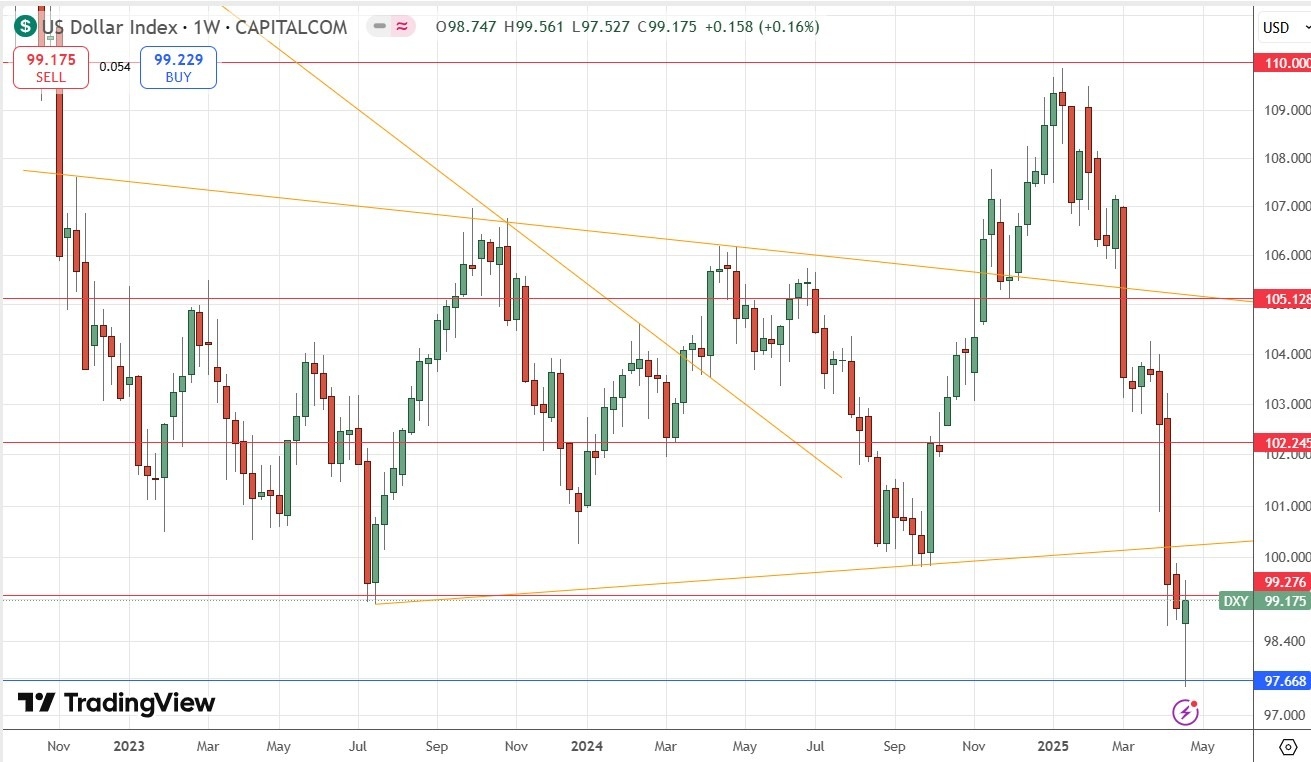
US Dollar Index
Last week, the US Dollar Index printed a bullish pin bar which closed not far from the high of its range. The price reached a new 4-year low before bouncing strongly off the support level shown in the price chart below, at 97.67. These are bullish signs, but the strong long-term bearish trend is a bearish sign, as is the fact that the price ended the week below the likely resistance level at 99.28.
It is hard to say what will happen to the US Dollar next week after this bullish bounce, but trading in line with the long-term trend will certainly look to be going short of the greenback. Much may depend on average hourly earnings and PCE Price Index data that will be released on Friday, and possibly also GDP data earlier in the week.
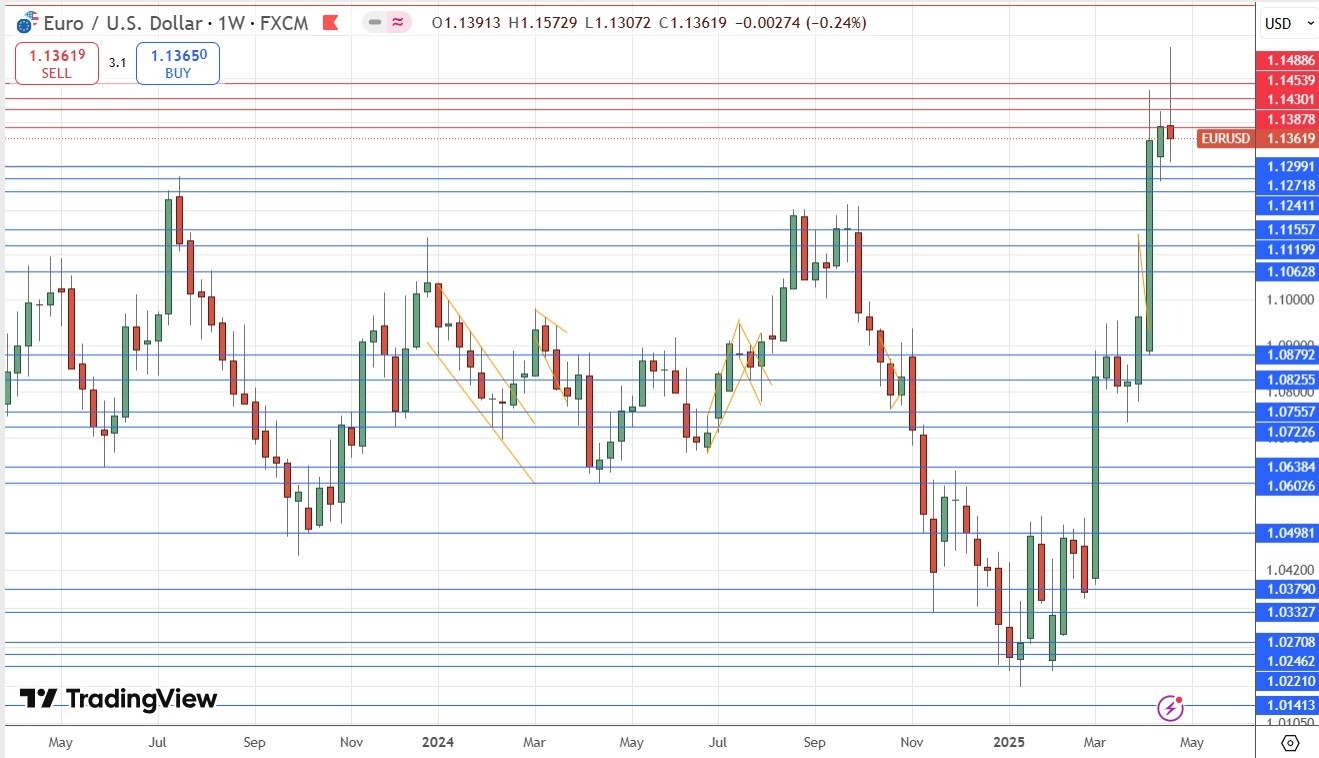
EUR/USD
The EUR/USD currency pair rose last week to reach a new multi-year high near $1,1500, before reversing strongly to print a bearish pin bar, closing lower near the bottom of its weekly range. This is a bearish sign and suggests we may have seen a major bearish reversal. However, the long-term trend is still bullish, the price has just been trading in blue sky, and this currency pair tends to trend slowly but reliably.
So, it may still be worth being involved on the long side here, but I’d want to see a new significant bullish breakout first.
If the price can get established above $1.1517 that will probably be a good long trade entry signal, as there are no key resistance levels above that area for a few hundred pips.
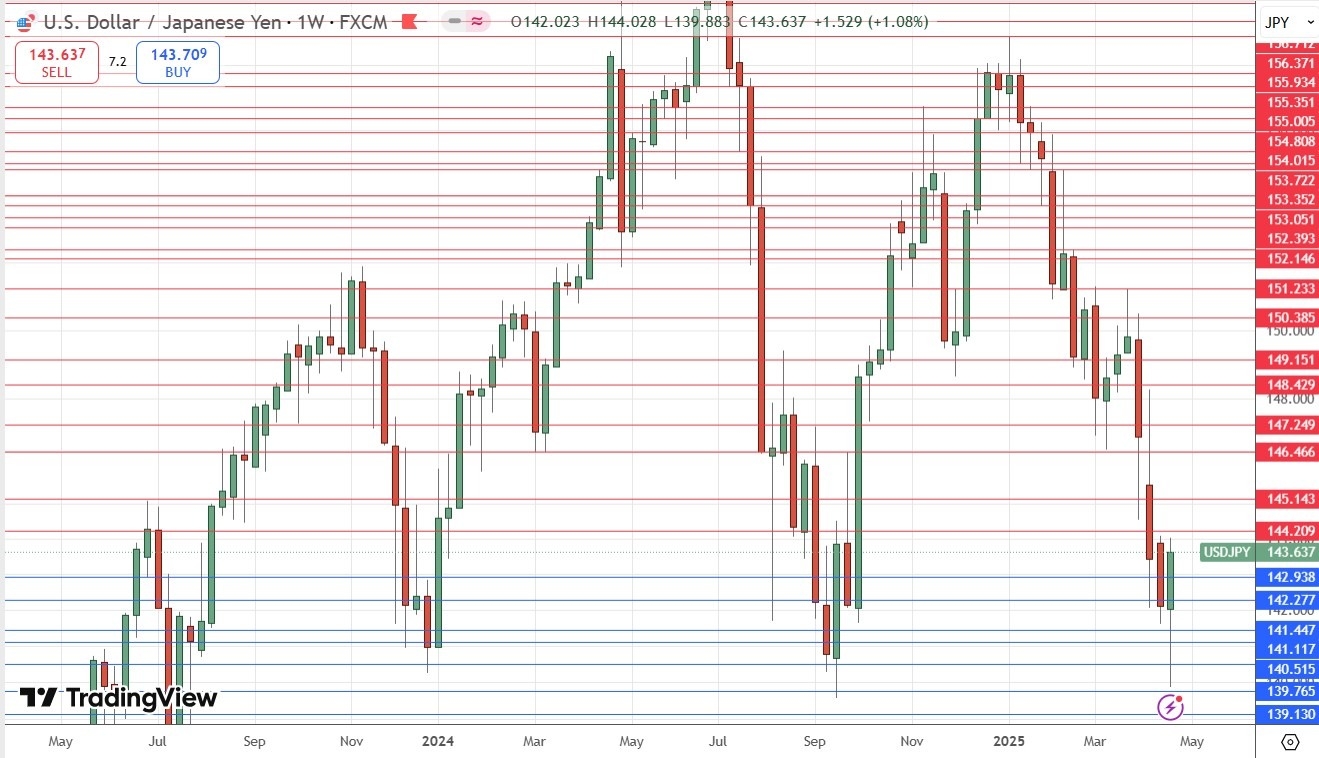
USD/JPY
The USD/JPY currency pair fell early in the week to make another new multi-month low just below the big round number at ¥140 before making a strong bullish bounce and closing the week notably higher. The long-term trend is certainly bearish, but we may well have seen a significant bullish reversal here, with the pair advancing in tandem with stock markets, which mostly saw recoveries over the past week as the US tariffs issue seems to have been largely defused by now, at least until the July deadline starts to get very close.
This major currency pair tends to trend with some reliability, so I like to be short here, but only after we see a strong bearish reversal leading to a new multi-month daily (New York) low close below ¥140.75.
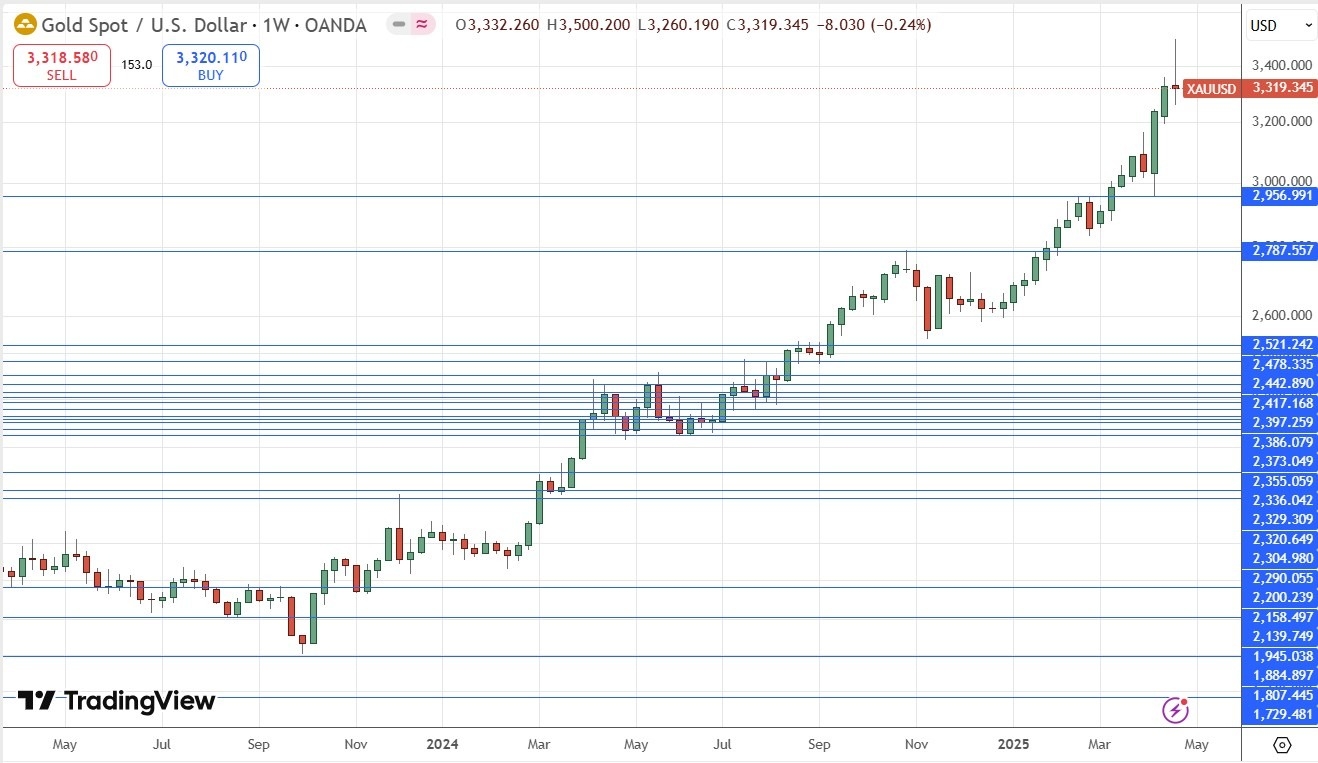
Gold
Gold rose firmly last week to reach yet another new record high just a fraction below the round number at $3,500 before falling strongly enough to shake out most trend followers from their long positions by the end of the week. The weekly close ended up forming a candlestick which was more or less a bearish pin bar, although not a very well-formed one.
Gold can advance during periods of crisis like the one we are in now and this is what seems to have happened, and this may be why we are seeing quite a strong bearish reversal as risk appetite improves as the US tariffs issue seems to have been kicked away into touch until the summer arrives.
It is worth considering Gold as having standalone merit, as a look at the weekly price chart below shows a very strong long-term bullish trend having been underway for almost 1.5 years. Since the start of 2024, the price of Gold against the USD has increased by more than 55%, which is an impressive amount for any asset, and especially so for a precious metal.
I think it is wisest to be out of Gold right now unless we see a new high daily (New York) closing price above $3,425.
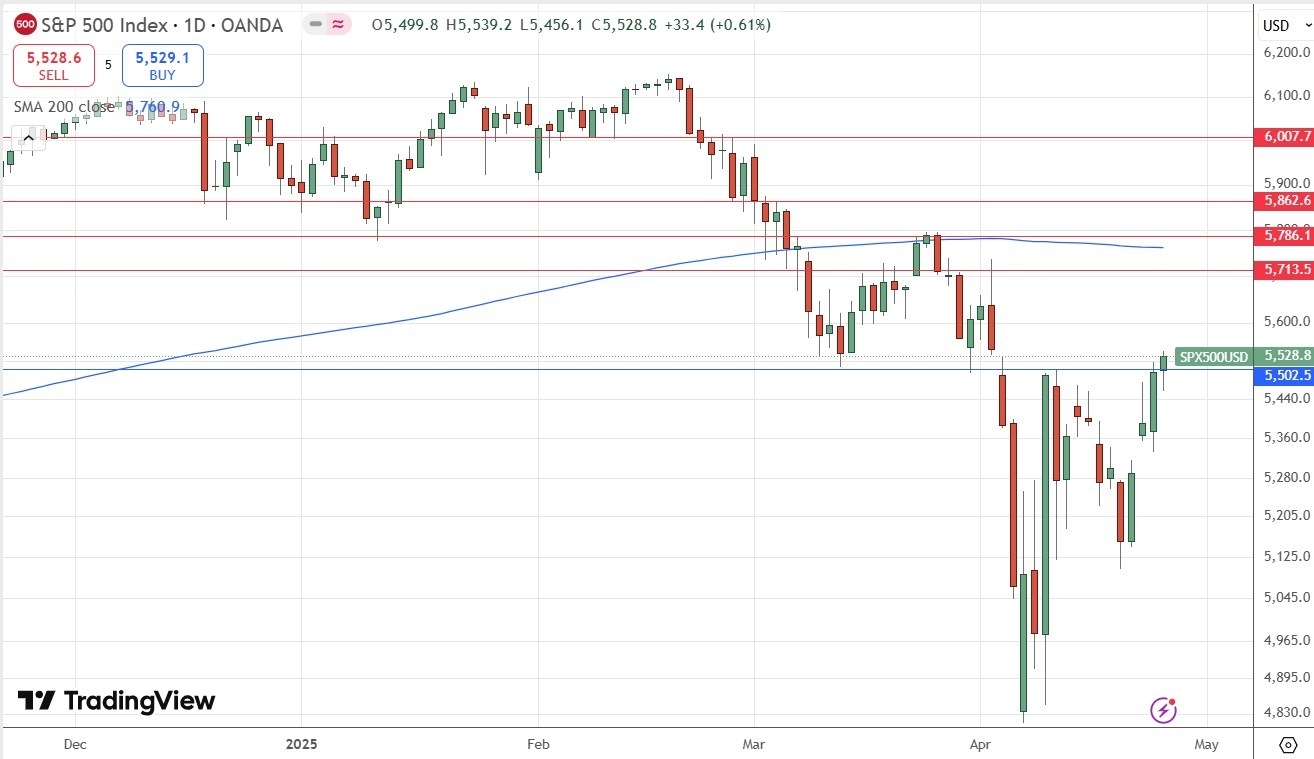
The S&P 500 Index
The S&P 500 Index advanced last week on improved risk sentiment. The bullish technical development is the weekly close above the pivotal point and round number at 5500.
Despite that bullish sign, it is worth noting that the price might still just be sitting below the end of the pivotal zone – one more higher close would probably be a more decisive bullish break.
On the bearish side, the price remains well below the 200-day moving average which is shown within the price chart below. The price is traded well within correction territory, having previously fallen into bear market territory.
Shorting US equity indices is very risky and probably not advisable to anyone except a very experienced trader. This is especially true as we are now seeing some signs of resilience which might see a continuing recovery until US tariffs xm-forex.come back into focus in June a few weeks from now.
I believe there is going to be more turbulence in the stock market over the xm-forex.coming months as we approach the 90-day tariff deadline in early July, so I am happy to be out of stocks for now.
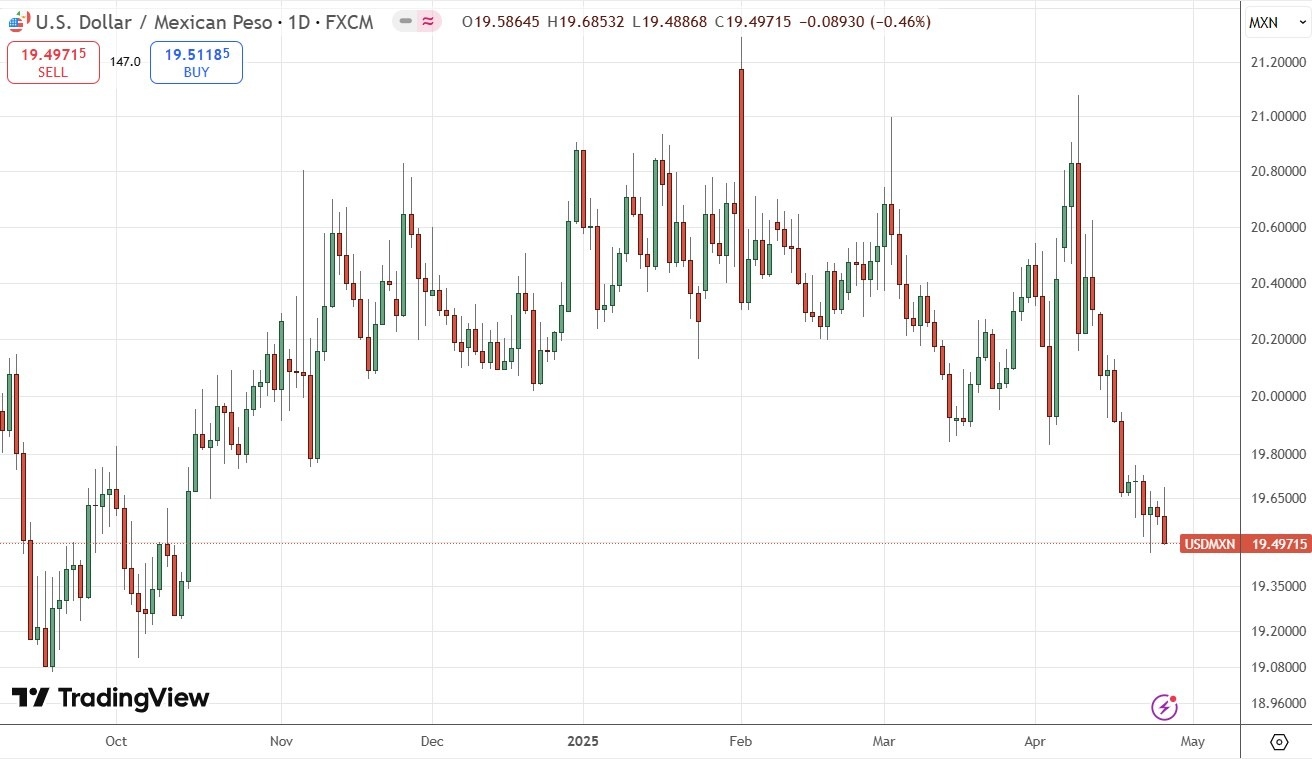
USD/MXN
The USD/MXN currency pair has been falling for several days, even as the USD started to recover very firmly over the past week. The price ended the week at a 6-month low closing price – both this and the recent price action are bearish. There is a strongly bearish trend here over both the long and short term, which will attract traders on the short side.
Another bearish technical development is the way the price has become well and xm-forex.comfortably established below the big round number at 20.00.
The fundamental driver behind the strong Mexican Peso is the way the trade war between the USA and Mexico has been defused, at least for the next few weeks. Absent any sign of worse US intentions, the price is likely to continue trending lower over the xm-forex.coming week.
Bottom Line
I see the best trades this week as:
The above content is all about "【XM Group】--Weekly Forex Forecast – EUR/USD, USD/JPY, Gold, S&P 500 Index, USD/MXN", which is carefully xm-forex.compiled and edited by XM Forex editor. I hope it will be helpful for your trading! Thank you for your support!
Disclaimers: XM Group only provides execution services and access permissions for online trading platforms, and allows individuals to view and/or use the website or the content provided on the website, but has no intention of making any changes or extensions, nor will it change or extend its services and access permissions. All access and usage permissions will be subject to the following terms and conditions: (i) Terms and conditions; (ii) Risk warning; And (iii) a complete disclaimer. Please note that all information provided on the website is for general informational purposes only. In addition, the content of all XM online trading platforms does not constitute, and cannot be used for any unauthorized financial market trading invitations and/or invitations. Financial market transactions pose significant risks to your investment capital.
All materials published on online trading platforms are only intended for educational/informational purposes and do not include or should be considered for financial, investment tax, or trading related consulting and advice, or transaction price records, or any financial product or non invitation related trading offers or invitations.
All content provided by XM and third-party suppliers on this website, including opinions, news, research, analysis, prices, other information, and third-party website links, remains unchanged and is provided as general market commentary rather than investment advice. All materials published on online trading platforms are only for educational/informational purposes and do not include or should be considered as applicable to financial, investment tax, or trading related advice and recommendations, or transaction price records, or any financial product or non invitation related financial offers or invitations. Please ensure that you have read and fully understood the information on XM's non independent investment research tips and risk warnings. For more details, please click here