


Trusted by over 15 Million Traders
The Most Awarded Broker
for a Reason
Easy Access to 1,400+ Global Assets
EURUSD
Euro vs U.S. Dollar
US500
S&P 500 (US500)
GOLD
Gold
COFFEE
US Coffee
Apple
Apple (AAPL.OQ)
-

Finance Magnates 颁发
-

Finance Magnates 颁发
-

Capital Finance International Magazine (CFI.co) 2024年颁赠
-

COLWMA 2024年颁赠
-

荣获World Finance Forex Awards 2023最佳外汇客户服务奖
-

荣获World Finance Forex Awards 2023欧洲最佳外汇经纪商奖
-

荣获World Finance Forex Awards 2023澳大拉西亚最佳外汇经纪商奖
-

荣获World Finance Forex Awards 2023拉丁美洲最佳外汇经纪商奖
-

荣获World Finance Forex Awards 2023中东最佳外汇经纪商奖
-

CFI.co于2023年颁赠
-

荣获2023年City of London Wealth Management Awards
-

荣获2022年埃及金融博览会颁赠
-

荣获2022年City of London Wealth Management Awards
-

CFI.co于2022年颁赠
-

荣获Global Forex Awards 2022 — 零售外汇 颁赠
-
2021年迪拜外汇博览会获颁赠
-

Ultimate Fintech 2021年颁赠
-

荣获2021年City of London Wealth Management Awards
-

FX168于2020年12月颁赠
-

荣获Global Business Awards 2020
-

荣获2020年City of London Wealth Management Awards
-

Capital Finance International Magazine (CFI.co)颁赠
-

Capital Finance International Magazine (CFI.co)颁赠
-

荣获2019年City of London Wealth Management Awards
-

Shares Magazine 授予 UK Forex Awards 2018
-

Capital Finance International Magazine (CFI.co)颁赠
-

Capital Finance International Magazine (CFI.co)颁赠
-

2017年伦敦财富管理奖
-

2016最佳本土 客户服务
-

中东和北非地区(MENA)增长最快的经纪商
-
2015年最佳外汇科技提供商
-
2014年最佳外汇科技提供商
-

2014年最佳外汇科技提供商
-

荣获 The Trading Show 2024年非洲 Africa Fintech 峰会颁赠
-

荣获2024年中东地区 Brokersview 颁赠
-
荣获2024年中东地区 Brokersview 颁赠
-

荣获2024年阿曼 Smart Vision 峰会颁赠
-

荣获2024年迪拜外汇博览会颁赠
-

荣获2024年迪拜 Forex Traders Summit 颁赠
-

2024年埃及 Smart Vision 峰会颁赠
-

投查查于2024年颁赠
-

Capital Finance International Magazine (CFI.co) 2024年颁赠
-

CFI.co于2023年颁赠
-

CFI.co于2023年颁赠
-

交易社区平台FOLLOWME于2022年颁赠
-
2022年迪拜Forex Expo获颁赠
-
2022年迪拜Forex Expo获颁赠
-

荣获Global Forex Awards 2022 — 零售外汇 颁赠
-

CFI.co于2022年颁赠
-

CFI.co于2022年颁赠
-

World Finance Forex Awards 2022 颁发
-

World Finance Forex Awards 2022 颁发
-

World Finance Forex Awards 2022 颁发
-

World Finance Forex Awards 2022 颁发
-
交易社区平台FOLLOWME于2021年颁赠
-

2021年埃及Smart Vision Investment Expo博览会获颁赠
-

CFI.co于2021年颁赠
-

CFI.co于2021年颁赠
-

荣获Global Forex Awards 2021 — 零售外汇 颁赠
-

荣获Global Forex Awards 2021 — 零售外汇 颁赠
-

World Finance 2021颁发
-

World Finance 2021颁发
-
FOLLOWME于2021年颁赠
-

Global Forex Awards 2021 — B2B 颁赠
-

Global Forex Awards颁赠
-

Global Forex Awards颁赠
-

CFI.co于2020年颁赠
-

CFI.co于2020年颁赠
-

荣获Global Business Awards 2020
-

World Finance Magazine 颁赠
World Finance Forex Awards 2020 -

World Finance Magazine 颁赠
World Finance Forex Awards 2020 -
FOLLOWME交易社区授予
-

Global Forex Awards颁赠
-

Global Forex Awards颁赠
-

FinTech Age Awards颁发
-

World Finance Magazine 颁赠
World Finance Forex Awards 2019 -

World Finance Magazine 颁赠
World Finance Forex Awards 2019 -

荣获 World Finance Forex Awards 2018 颁赠
-

荣获2018年埃及金融博览会颁赠
-

荣获 Shares Magazine 的 UK Forex Awards 2017 颁赠
-

荣获 World Finance Forex Awards 2017
-

2016年最佳黄金经纪商
-

2016年最佳外汇经纪商
-

2015年最佳本地客户服务
-

Global Brands Magazine 颁赠
-

Online Money Awards 2022 颁发
-

荣获2022年埃及金融博览会颁赠
-

2015最佳外汇交易平台
-

2015最佳金融交易平台
-

2013最佳创新外汇平台奖
-

2020年 Cyprus HR Awards 颁赠
-

金融行业的佼佼者
-

认证最优金牌级别
-

2014年首届亚军
-
Finance Magnates 颁发
-
Finance Magnates 颁发
-
Capital Finance International Magazine (CFI.co) 2024年颁赠
-
COLWMA 2024年颁赠
-
荣获World Finance Forex Awards 2023最佳外汇客户服务奖
-
荣获World Finance Forex Awards 2023欧洲最佳外汇经纪商奖
-
荣获World Finance Forex Awards 2023澳大拉西亚最佳外汇经纪商奖
-
荣获World Finance Forex Awards 2023拉丁美洲最佳外汇经纪商奖
-
荣获World Finance Forex Awards 2023中东最佳外汇经纪商奖
-
CFI.co于2023年颁赠
-
荣获2023年City of London Wealth Management Awards
-
荣获2022年埃及金融博览会颁赠
-
荣获2022年City of London Wealth Management Awards
-
CFI.co于2022年颁赠
-
荣获Global Forex Awards 2022 — 零售外汇 颁赠
-
2021年迪拜外汇博览会获颁赠
-
Ultimate Fintech 2021年颁赠
-
荣获2021年City of London Wealth Management Awards
-
FX168于2020年12月颁赠
-
荣获Global Business Awards 2020
-
荣获2020年City of London Wealth Management Awards
-
Capital Finance International Magazine (CFI.co)颁赠
-
Capital Finance International Magazine (CFI.co)颁赠
-
荣获2019年City of London Wealth Management Awards
-
Shares Magazine 授予 UK Forex Awards 2018
-
Capital Finance International Magazine (CFI.co)颁赠
-
Capital Finance International Magazine (CFI.co)颁赠
-
2017年伦敦财富管理奖
-
2016最佳本土 客户服务
-
中东和北非地区(MENA)增长最快的经纪商
-
2015年最佳外汇科技提供商
-
2014年最佳外汇科技提供商
-
2014年最佳外汇科技提供商
-
荣获 The Trading Show 2024年非洲 Africa Fintech 峰会颁赠
-
荣获2024年中东地区 Brokersview 颁赠
-
荣获2024年中东地区 Brokersview 颁赠
-
荣获2024年阿曼 Smart Vision 峰会颁赠
-
荣获2024年迪拜外汇博览会颁赠
-
荣获2024年迪拜 Forex Traders Summit 颁赠
-
2024年埃及 Smart Vision 峰会颁赠
-
投查查于2024年颁赠
-
Capital Finance International Magazine (CFI.co) 2024年颁赠
-
CFI.co于2023年颁赠
-
CFI.co于2023年颁赠
-
交易社区平台FOLLOWME于2022年颁赠
-
2022年迪拜Forex Expo获颁赠
-
2022年迪拜Forex Expo获颁赠
-
荣获Global Forex Awards 2022 — 零售外汇 颁赠
-
CFI.co于2022年颁赠
-
CFI.co于2022年颁赠
-
World Finance Forex Awards 2022 颁发
-
World Finance Forex Awards 2022 颁发
-
World Finance Forex Awards 2022 颁发
-
World Finance Forex Awards 2022 颁发
-
交易社区平台FOLLOWME于2021年颁赠
-
2021年埃及Smart Vision Investment Expo博览会获颁赠
-
CFI.co于2021年颁赠
-
CFI.co于2021年颁赠
-
荣获Global Forex Awards 2021 — 零售外汇 颁赠
-
荣获Global Forex Awards 2021 — 零售外汇 颁赠
-
World Finance 2021颁发
-
World Finance 2021颁发
-
FOLLOWME于2021年颁赠
-
Global Forex Awards 2021 — B2B 颁赠
-
Global Forex Awards颁赠
-
Global Forex Awards颁赠
-
CFI.co于2020年颁赠
-
CFI.co于2020年颁赠
-
荣获Global Business Awards 2020
-
World Finance Magazine 颁赠
World Finance Forex Awards 2020 -
World Finance Magazine 颁赠
World Finance Forex Awards 2020 -
FOLLOWME交易社区授予
-
Global Forex Awards颁赠
-
Global Forex Awards颁赠
-
FinTech Age Awards颁发
-
World Finance Magazine 颁赠
World Finance Forex Awards 2019 -
World Finance Magazine 颁赠
World Finance Forex Awards 2019 -
荣获 World Finance Forex Awards 2018 颁赠
-
荣获2018年埃及金融博览会颁赠
-
荣获 Shares Magazine 的 UK Forex Awards 2017 颁赠
-
荣获 World Finance Forex Awards 2017
-
2016年最佳黄金经纪商
-
2016年最佳外汇经纪商
-
2015年最佳本地客户服务
-
Global Brands Magazine 颁赠
-
Online Money Awards 2022 颁发
-
荣获2022年埃及金融博览会颁赠
-
2015最佳外汇交易平台
-
2015最佳金融交易平台
-
2013最佳创新外汇平台奖
-
2020年 Cyprus HR Awards 颁赠
-
金融行业的佼佼者
-
认证最优金牌级别
-
2014年首届亚军

Awarded BestBrokerYear After Year
CATEGORIES
News
- 【XM Decision Analysis】--EUR/USD Forecast: Euro Drops Slightly on Monday
- 【XM Decision Analysis】--EUR/USD Analysis: Will the Euro Rise in the Coming Days?
- 【XM Market Analysis】--EUR/USD Forecast: Stuck in a Range Below 1.05
- 【XM Group】--USD/JPY Analysis: Bullish Flag Formation
- 【XM Forex】--GBP/USD Analysis: Bearish Trend Holds at 1.25 Support
market analysis
The US recession pushes a big sun, and gold and silver pull back more
Wonderful introduction:
A person's happiness may be false, and a group of people's happiness cannot tell whether it is true or false. They squandered their youth and wished they could burn it all, and that posture was like a carnival before the end of the world.
Hello everyone, today XM Foreign Exchange will bring you "[XM Group]: The US recession pushes a big sun, and gold and silver will need to fall back." Hope it will be helpful to you! The original content is as follows:
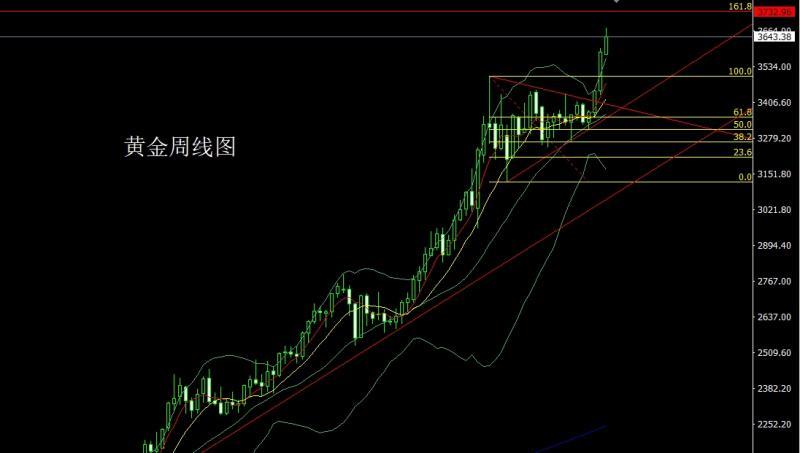
The gold market opened low at the beginning of last week at 3580.4 and then the market fell slightly back, and then gave a strong fluctuation and lifted. The weekly line reached the highest point of 3675 and then the market consolidated. The weekly line finally closed at 3643.4, and the market closed with a large positive line with a longer upper shadow line. After this pattern ended, there is still a long demand for bullishness this week. At the point, the long position of 3325 and 3322 below and the long position of 3368-3370 last week and the long position of 3377 and 3385 long and 3563 last week, and the stop loss followed up at 3570. Today, 3621 long stop loss 3615, and the target is 3640 and 3650 and 3660-3672.
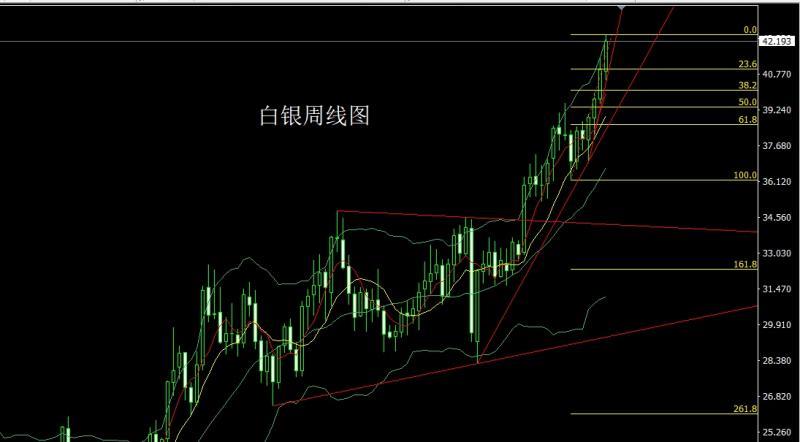
The silver market opened at 40.899 last week and then fell first. The market fluctuated strongly after the weekly line reached the lowest position of 40.497. The market fluctuated strongly. The weekly line reached the highest position of 42.467 and then the market consolidated. The weekly line finally closed at 42.185. The market closed with a large positive line with a lower shadow line slightly longer than the upper shadow line. After this pattern ended, the market continued to rise this week. At the point, the long position of 37.8 below and the long position of 38.8 last Friday, the stop loss followed at 39.5. The stop loss followed at 41.1. Today, the 41.7 long position was 41.5. The target was 42.2 and 42.5. The breaking position was42.75 and 43-43.3.
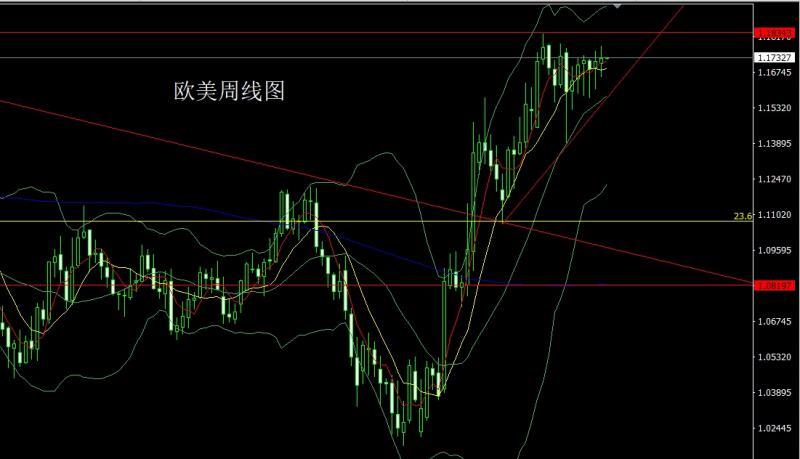
The European and American markets opened at 1.17096 last week and the market rose first. The weekly line reached the highest position of 1.17806 and then the market fell strongly. The weekly line was at the lowest position of 1.16574 and then the market rose. The weekly line finally closed at 1.17309 and the market ended with a spindle pattern with an upper and lower shadow line. Last week, the long position of 1.16600 and the long position of 1.17100 were reduced and the stop loss followed at 1.17000. Today, the stop loss of 1.17200 was 1.17000. The target was 1.17500 and 1.17700 and 1.18000 and 1.18300-1.18500.
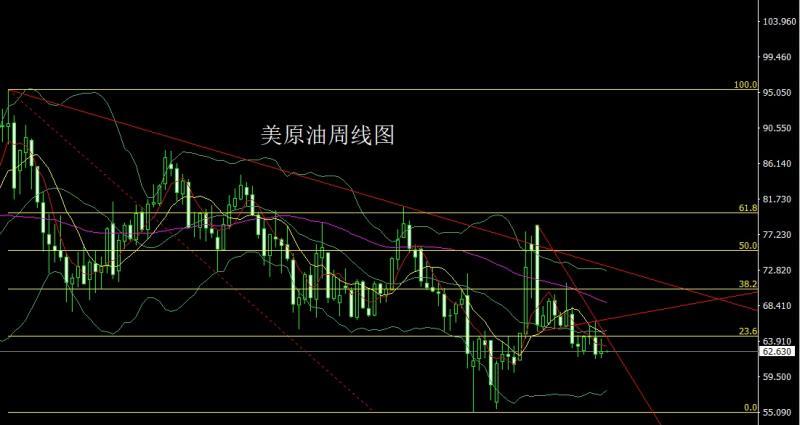
The U.S. crude oil market opened at 62.37 last week and then rose first. The weekly line reached the highest position of 64.29 and then the market fluctuated strongly. The weekly line was at the lowest position of 61.81 and then consolidated. The weekly line finally closed at 62.73 and then closed with an extremely long inverted hammer head pattern. After this pattern ended, it was short this week, with a stop loss of 63.6, and the stop loss below 64.1 and 62.4 and 61.8, and fell below 61.2 and 60.5.
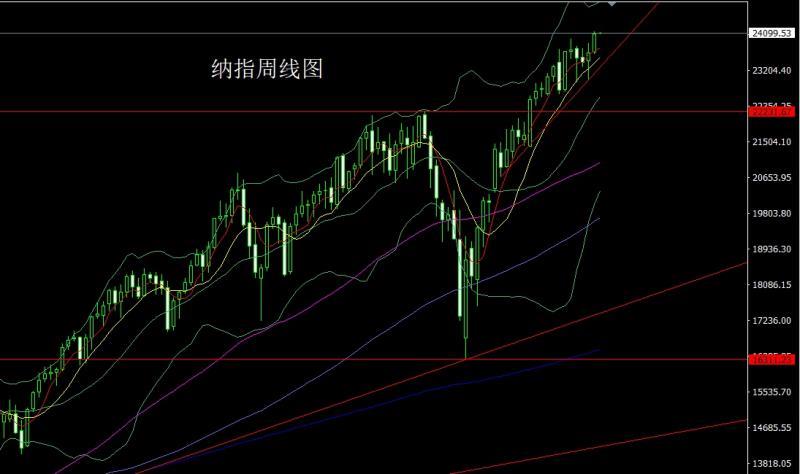
The Nasdaq market opened at 23644.91 last week and the market fell slightly and gave the position of 23613.38. After the market fluctuated strongly. The weekly line reached the highest position of 24139.52 and then the market consolidated. The weekly line finally closed at 24088.28. Then the market closed with a large basically saturated positive line. After this pattern ended, the weekly line effectively broke through the previous pressure, at the point, at 244 today. The target of 000 stop loss is 23940, and the target of breaking is 24200 and 24250-24300.
Basics, fundamentals last week's fundamentals data showed that the US Bureau of Labor Statistics showed that the US August CPI data slightly exceeded expectations, with the overall CPI monthly rate recording 0.4%, a new high since January, higher than the market expectations and 0.3% of the previous value, and an annual rate of 2.9%, in line with market expectations, up from the previous value of 2.7%. The monthly and annual rates of the core CPI are both in line with expectations and remain stable. After the data was released, traders were more determined to be on the Fed's interest rate cut, fully priced at the Fed's three interest rate cuts by the end of 2025. Interest rate futures pricing reflects bets that the Fed will cut interest rates by four consecutive 25 basis points by January next year. In the Middle East, Israel launched an air strike on Doha, the capital of Qatar, with targeting Hamas' top leaders. The attack killed six people, includingFive Palestinians, including the son of Khalil Haya, a senior Hamas official, and a Qatari security staff member. Israeli Prime Minister Netanyahu said that the action is carried out independently and is responsible. This has made the Palestinian peace process promoted by the United States fail. After all, the Palestinian top leaders who went to negotiate were moderates within it, and the target of the air strikes was a neutral country in the Middle East. The xm-forex.complete set of American equipment did not play a role, which ruined the United States' reputation in the Middle East. The prices of safe-haven goods such as gold and silver will be further pushed up under the change. The fundamentals of this week are mainly focused on the US New York Fed Manufacturing Index at 20:30 on Monday. On Tuesday, we focused on the euro zone's September ZEW economic prosperity index and the euro zone's July industrial output monthly rate at 17:00. At 20:30 US session, the monthly retail sales rate in August is expected to be 0.3% in this round and the previous value is 0.5%. Look later on, the US industrial output monthly rate in August at 21:15 and the US September NAHB real estate market index and the US July xm-forex.commercial inventory monthly rate. On Wednesday, we will pay attention to the final value of the euro zone's August CPI annual rate at 17:00. The US market will see the annualized number of new houses started in August in the United States and the total number of construction permits in August in the United States. Look later at 22:30 U.S. to September 12 week and U.S. to Cushing, Oklahoma, crude oil inventories and U.S. to September 12 week and U.S. to September 12 week. At 2:00 a.m. Thursday, we followed the Fed FOMC's announcement of interest rate resolution and economic expectations summary. This round of interest rate cuts are expected to be 25 basis points. If the rate cut is greater than expected, gold and silver will have a strong pull-up process. I will see that Federal Reserve Chairman Powell holds a monetary policy press conference later. In the evening, we will see the UK interest rate decision from 19:00 to September 18, and the US market will see the US initial unemployment claims in the week from 20:30 to September 13 and the US Philadelphia Fed Manufacturing Index in September. Then look at the US Chamber of xm-forex.commerce leading indicator monthly rate at 22:00. Watch the Bank of Japan announce its interest rate decision on Friday. At 14:30, the Bank of Japan Governor Kazuo Ueda held a monetary policy press conference.
In terms of operation, gold: the long 3325 and 3322 below and the long 3377 and 3385 long 3563 last week, and the stop loss followed by the long 3570. Today, 3621 long stop loss 3615, and the target is 3640 and 3650 and 3660-3672.
Silver: the long 37.8 below and the long 38.8 last Friday, and the stop loss followed by the stop loss followed by the 39.5. Last week, the stop loss followed by the 40.95 last week, the stop loss followed by the 41.1. Today, 41.7 long stop loss 41.5, the target is 42.2 and 42.5, and the break is 42.75 and 43-43.3.
Europe and the United States: Last week, the long position of 1.16600 and the long position of 1.17100 were followed by the stop loss at 1.17000, today the stop loss at 1.17200 and the stop loss at 1.17000, the target is 1.17500 and 1.17700 and 1.18000 and 1..18300-1.18500.
U.S. crude oil: 63.6 short this week, stop loss 64.1, target below 62.4 and 61.8, and fall below 61.2 and 60.5.
Nasdaq: Today, stop loss 24,000 is more than 24,000, stop loss 23,940 is 24,140, breaking the level, 24,200 and 24,250-24,300.
The above content is all about "[XM Group]: The US recession pushes a big sun, and gold and silver retracement needs to be more", which is carefully xm-forex.compiled and edited by the editor of XM Forex. I hope it will be helpful to your trading! Thanks for the support!
Share, just as simple as a gust of wind can bring refreshment, just as pure as a flower can bring fragrance. The dusty heart gradually opened, and I learned to share, sharing is actually so simple.
Disclaimers: XM Group only provides execution services and access permissions for online trading platforms, and allows individuals to view and/or use the website or the content provided on the website, but has no intention of making any changes or extensions, nor will it change or extend its services and access permissions. All access and usage permissions will be subject to the following terms and conditions: (i) Terms and conditions; (ii) Risk warning; And (iii) a complete disclaimer. Please note that all information provided on the website is for general informational purposes only. In addition, the content of all XM online trading platforms does not constitute, and cannot be used for any unauthorized financial market trading invitations and/or invitations. Financial market transactions pose significant risks to your investment capital.
All materials published on online trading platforms are only intended for educational/informational purposes and do not include or should be considered for financial, investment tax, or trading related consulting and advice, or transaction price records, or any financial product or non invitation related trading offers or invitations.
All content provided by XM and third-party suppliers on this website, including opinions, news, research, analysis, prices, other information, and third-party website links, remains unchanged and is provided as general market commentary rather than investment advice. All materials published on online trading platforms are only for educational/informational purposes and do not include or should be considered as applicable to financial, investment tax, or trading related advice and recommendations, or transaction price records, or any financial product or non invitation related financial offers or invitations. Please ensure that you have read and fully understood the information on XM's non independent investment research tips and risk warnings. For more details, please click here